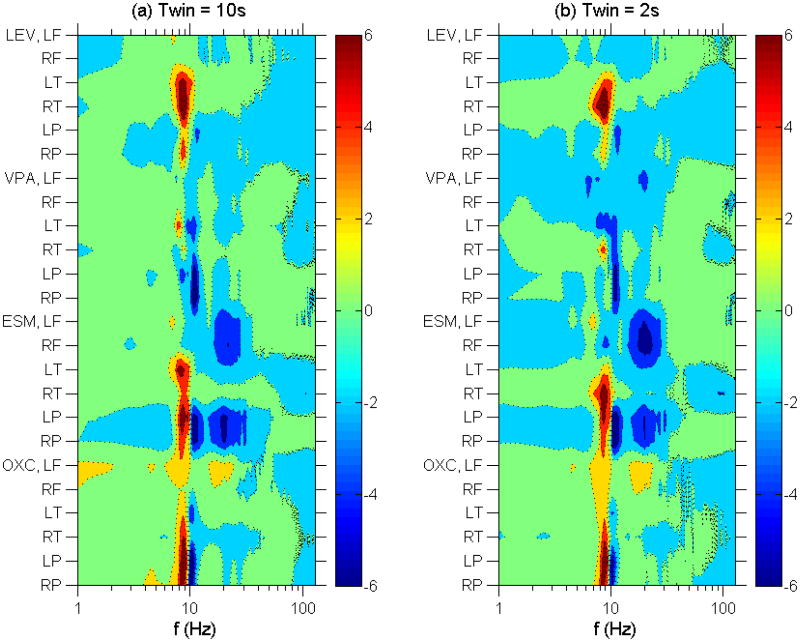
Figure 3.
Left panel (3a): Contour plot of normalized linear regression coefficients vs anticonvulsant therapy and EEG spectral frequency using 10 s time windows. Vertical axis lists the anticonvulsant broken down into brain regions. Horizontal axis gives the frequency on a logarithmic scale. The color intensity scale gives the normalized linear regression coefficients in standard deviations. Right panel (3b): Same as 3a using 2 s time windows.

