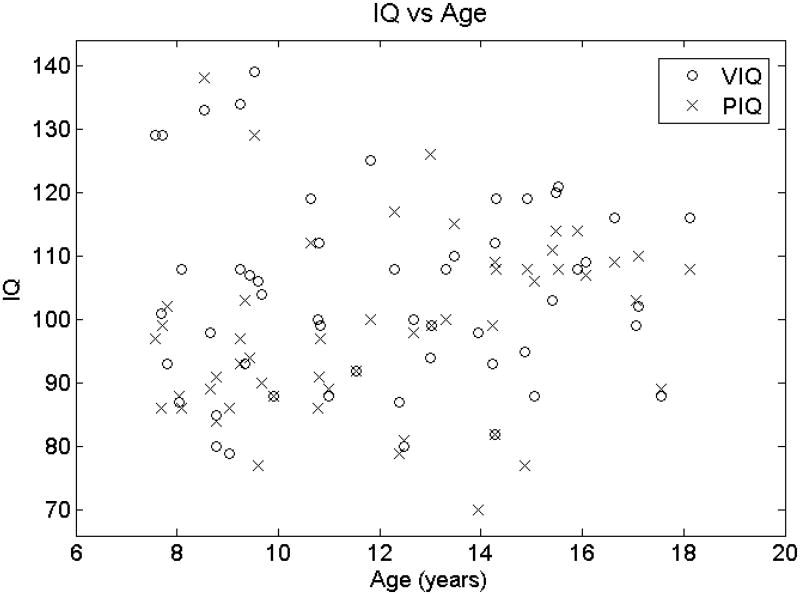
Figure 4.
VIQ (open circles) and PIQ (X) vs age (horizontal axis). A linear least squares fit of VIQ as a function of age yields a slope of -0.23 IQ points per year with a 95% confidence range of (−1.64,1.19) IQ points per year. A linear least squares fit of PIQ as a function of age yields a slope of 0.97 IQ points per year with a 95% confidence range of (−0.30,2.25) IQ points per year. Therefore, younger children do not have higher PIQ's.

