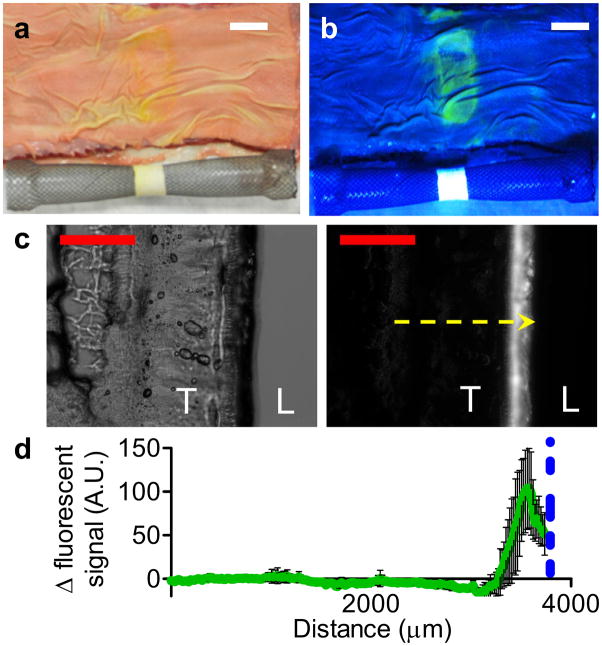
Figure 4.
Ex vivo delivery of fluorescein diacetate from superhydrophobic devices. Photographs of tension-responsive device integrated with esophageal stent (ε = 1.0) and fluorescein diacetate delivery (yellow, green) to bovine esophagus under (a) white and (b) UV light. Scale bar (white) = 20 mm. (c) Representative bright field (left) and fluorescent (right) microscopy images of esophagus cross-section after delivery. T denotes esophageal tissue and L denotes lumen space. Scale bar (red) = 2.5 mm; yellow arrow represents analysis profile. (d) Fluorescence intensity profile across esophagus cross-section. Blue dotted line represents mucosal-device boundary; error bars denote ± SD for n = 4.

