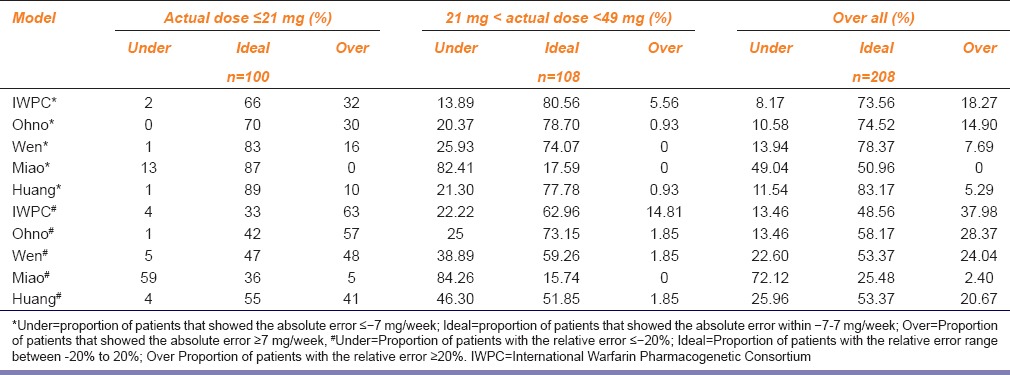
Table 3.
Proportions of patients of different dose groups that showed the absolute errors and relative error between the predicted doses and the actual doses of five kinds of pharmacogenomics-based individualized warfarin dosing model

Proportions of patients of different dose groups that showed the absolute errors and relative error between the predicted doses and the actual doses of five kinds of pharmacogenomics-based individualized warfarin dosing model
