
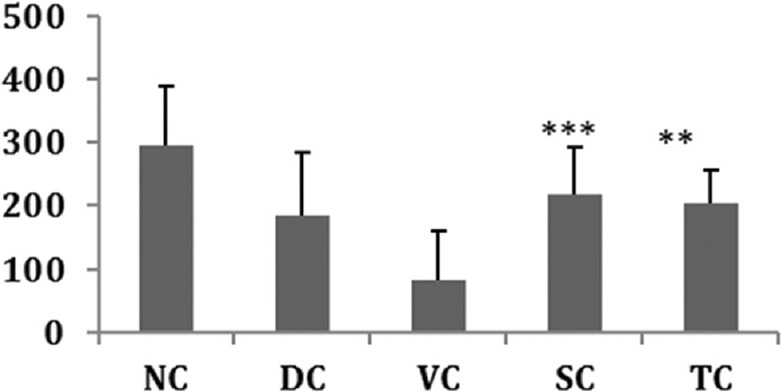
Figure 4.
Effect on bone hardness. All values represent mean ± standard deviation; **P<0.01; **P<0.001 as compared to Vehicle control group (analysis of variance followed by post hoc tests)
Official websites use .gov
A
.gov website belongs to an official
government organization in the United States.
Secure .gov websites use HTTPS
A lock (
) or https:// means you've safely
connected to the .gov website. Share sensitive
information only on official, secure websites.
Effect on bone hardness. All values represent mean ± standard deviation; **P<0.01; **P<0.001 as compared to Vehicle control group (analysis of variance followed by post hoc tests)