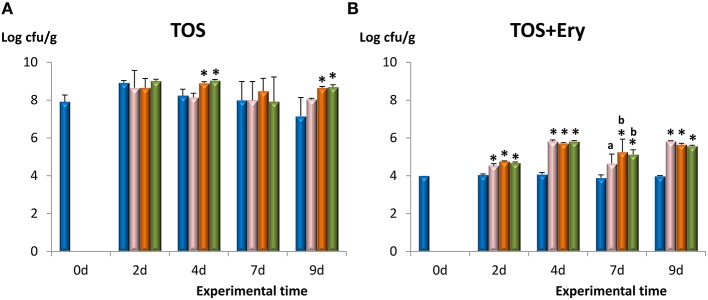
Figure 2.
Counts in agar-TOS to enumerate total bifidobacterial population (A) and agar-TOS+Ery (supplemented with 2.5 μg/ml erythromycin, the antibiotic marker of strains under study) to enumerate erythromycin-resistant bacteria (B) in fecal homogenates obtained from four experimental groups of mice along the experimental period. Placebo group ( ), feed B. animalis subsp. lactis ΔBalat_1410 (
 ), feed B. animalis subsp. lactis Balat_1410 (
 ), and feed B. animalis subsp. lactis Balat_1410S89L (
 ). Within each treatment day: statistical differences with respect to the control group are marked with an asterisk (p < 0.05) and differences among the three bifidobacterial groups are denoted with different letters (p < 0.05).

