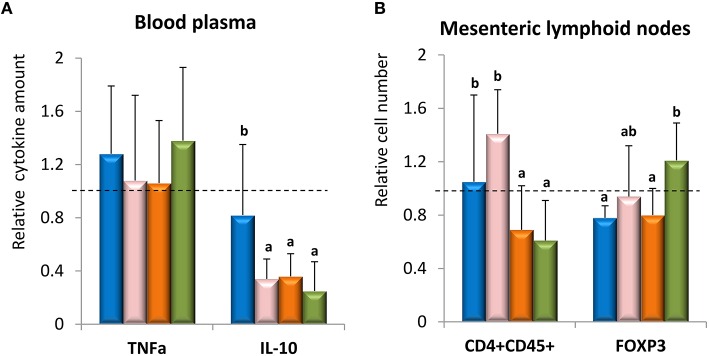
Figure 4.
Mean values of relative TNFα and IL-10 cytokines measured in blood samples (A) and relative number of CD4+CD25+ (T helper cells) and FOXP3 (T regulatory cells) quantified in mesenteric lymphoid nodes (B). Samples were collected after 6-days of DSS-treatment. Values of each DSS-colitic animal group were referred to as the average of those obtained in the reference group (value = 1). Placebo group ( ), feed B. animalis subsp. lactis ΔBalat_1410 (
 ), feed B. animalis subsp. lactis Balat_1410 (
 ), feed B. animalis subsp. lactis Balat_1410S89L (
 ). Within each parameter: statistical differences among the four groups are denoted with different letters (p < 0.05).

