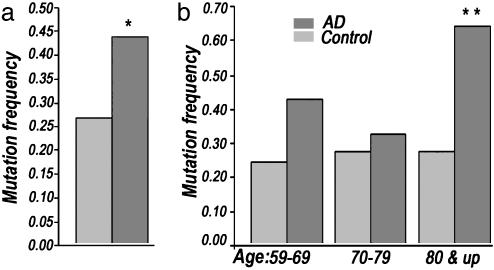
Fig. 3.
Total number of heteroplasmic mtDNA CR mutations observed by cloning and sequencing CR clones from AD and control brain samples. (a) Number of mutants from all age groups (range 59–94); *, P < 0.01. (b) Number of mutants from three different age groups: 59–69, 70–79, and 80 & up; for 80 & up DNA mutation frequency, **, P < 0.001.

