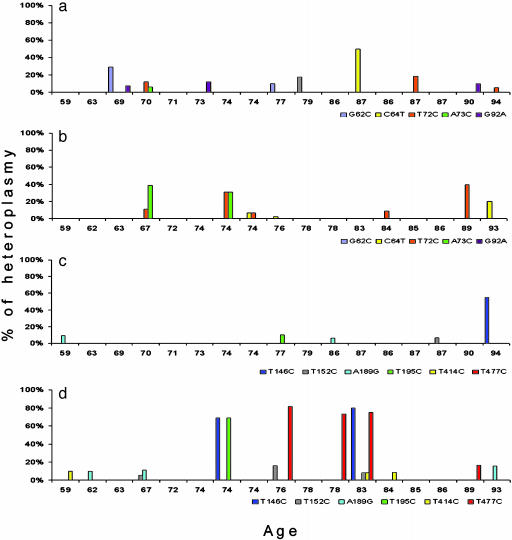
Fig. 4.
Specific somatic mtDNA CR mutants and their percentage of heteroplasmy in AD and control brains. Subjects are listed by age. CR nps 1–100: (a) control brains; (b) AD brains. CR nps 101–570: (c) control brains; (d) AD patient brains. The specific mutations are listed below the abscissa lines and color-coded. The percentage of each mutation in each individual's brain is given by the height of the bar of that color. Homoplasmic germ-line mutations were also observed for these mutations. For the np 1–100 region, A73G was seen in six ADs and four controls. In the np 101–570 region, T146C was seen in three ADs and two controls; T152C was seen in three ADs and four controls; A189G was seen in no ADs and one control; and T195C was seen in two ADs and two controls. T414C and T477C were not found in the homoplasmic state in either AD or control samples.

