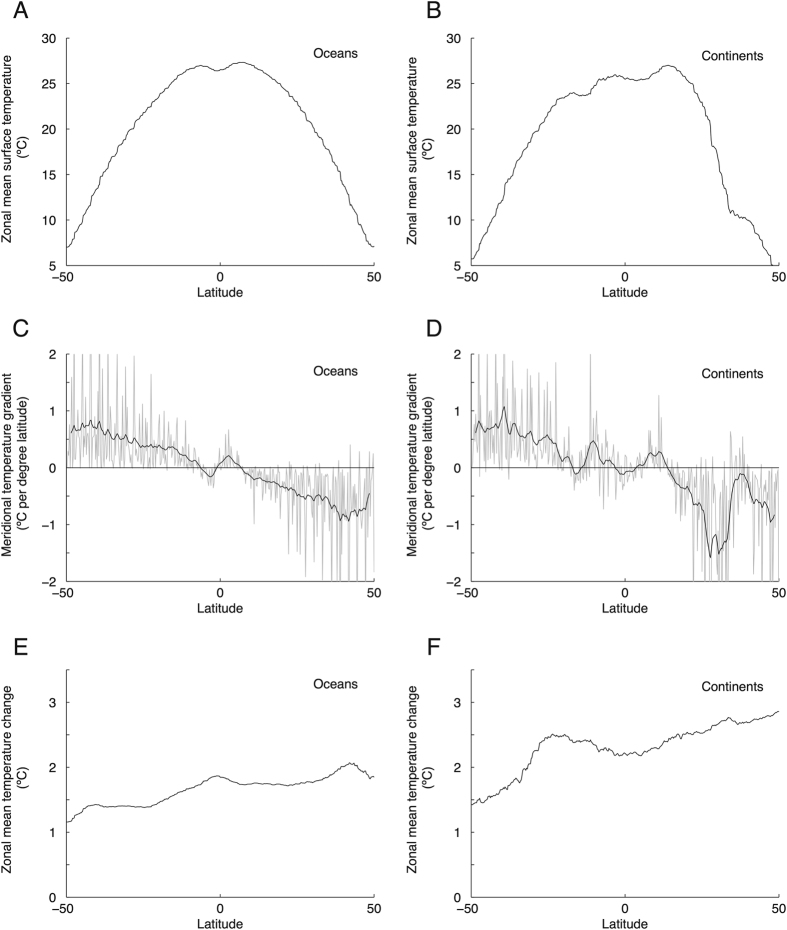
Figure 1. Zonally-averaged surface temperature patterns averaged over 20 climate models.
(A) Zonal mean surface temperature T(y) of ocean pixels, 2011–2030. (B) Same, but for continental pixels. (C) Derivative dT(y)/dy for panel A (grey, smoothed is black). (D) Same, but for panel B. (E) Zonal mean ocean surface temperature change ΔT(y) between 2011–2030 and 2080–2099. (F) Same, but for continents.

