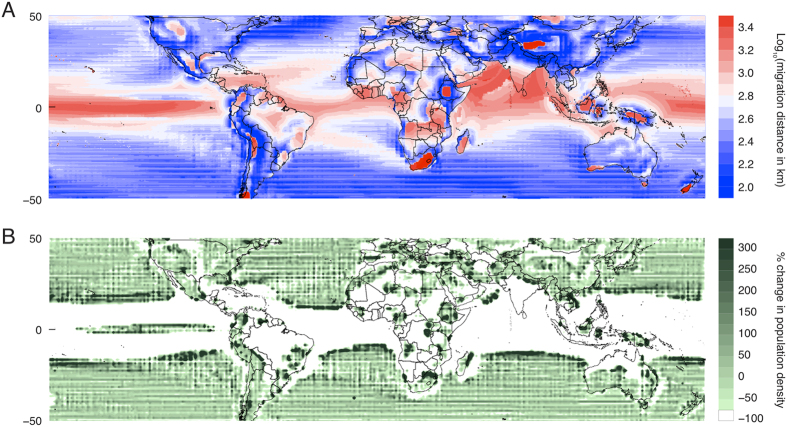
Figure 3. The length of minimum-distance temperature-preserving displacements and their impact on population density.
The shortest temperature-preserving migration is computed for each pixel under 2 °C of global mean warming. Populations that are initially in the ocean (on land) are constrained to remain in the ocean (on land). Striped appearance over some regions occurs because the combined climate models vary in spatial resolution. (A) Logarithm of the minimum distance that an organism must travel to maintain the average temperature of its environment, plotted as a function of the organism’s initial location. (B) The percent change in population density that occurs if a hypothetical population were initially distributed uniformly over the globe and all members of that population undertake the minimum-distance temperature-preserving displacement in (A). Maps created by authors using Matlab.

