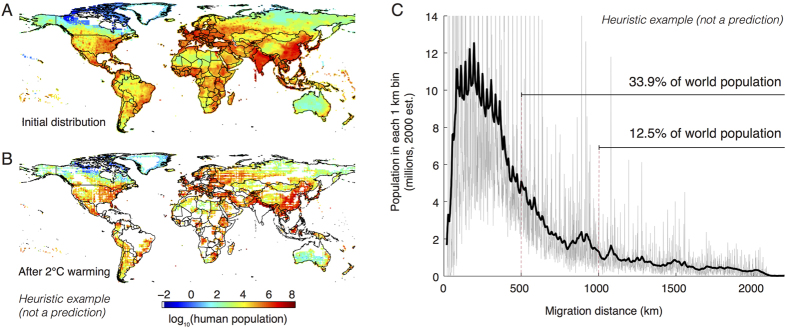
Figure 4. Heuristic example applying results to the global human population.
To aid in visualizing the result of this analysis, temperature-preserving displacements are applied to the global distribution of the people as an illustrative thought experiment, since this is one species distribution that is familiar and well documented. Actual human migrations will certainly differ and likely will be less extreme, as people can adapt and access technologies that may allow them to avoid displacement, behaviors that are abstracted away in this analysis. (A) Logarithm of the current distribution of humans41. (B) The distribution of this population if all individuals undertake the displacement in Fig. 3. (C) Histogram with 1 km bins (grey, smoothed is black) for the minimum distance traveled by each person currently on Earth. Maps created by authors using Matlab.

