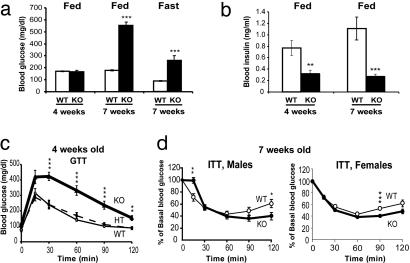
Fig. 2.
Metabolic measurements in Ncb5or +/+, +/-, and -/- mice. (a) Blood glucose levels in fed male mice of age 4 weeks (n:WT = 7, KO = 7) and fed or fasting male mice of age 7 weeks (n:WT = 8, KO = 9). (b) Serum insulin levels in fed male mice of age 4 weeks (n:WT = 6, KO = 7) and fed male mice of age 7 weeks (n:WT = 8, KO = 9). (c) Glucose tolerance tests (GTT) on Ncb5or +/+ (WT), +/- (HT), and -/- (KO) male mice of age 4 weeks (n:WT = 8, HT = 12, KO = 7). (d) Insulin tolerance tests (ITT) on 7-week-old male (Left, n:WT = 8, KO = 8) and female (Right, n:WT = 10, KO = 12) mice. Error bars designate mean ± SEM. *, P < 0.05; **, P < 0.01; ***, P < 0.001 versus WT, unpaired two-tailed t test.

