FIG. 2.
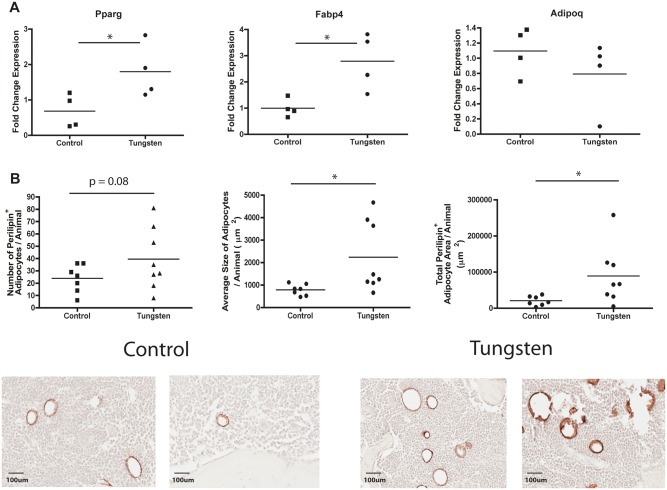
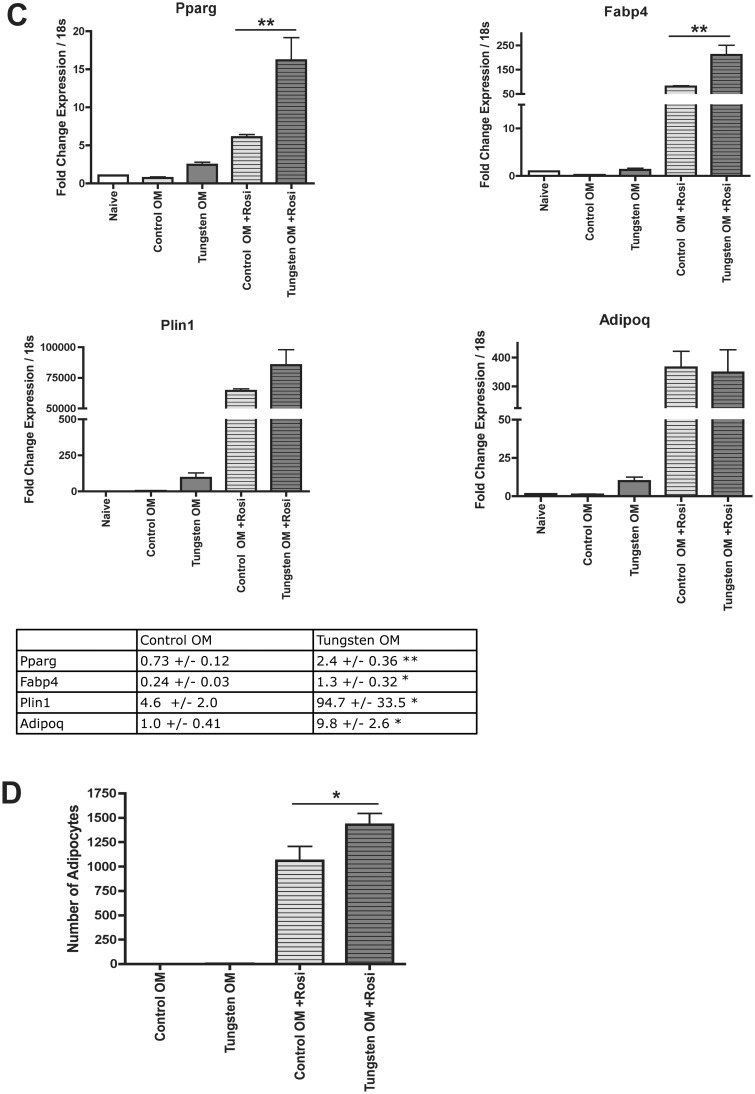
Tungsten promotes adipogenesis in the bones of mice. Male C57BL/6 mice (5 weeks) were given tap water (control) or 15 ppm tungsten in drinking water for 4 weeks. A, RNA expression analysis of adipogenic gene markers Pparg, Fabp4, Adipoq in total bone marrow isolated from control and tungsten exposed animals, analyzed by qRT-PCR. Graph shows mean fold change in gene expression normalized to one control sample (n = 4). Data normalized to housekeeping genes Gapdh and m36B4. *P ≤ .5 unpaired student t test, 2-tailed. B, Analysis of perilipin staining by IHC in sections of femur bone tissue from control and tungsten exposed animals. Graphs show the mean number of perilipin+ adipocytes/animal, average size of each adipocyte/animal, and the total perilipin+ adipocyte area/animal (n ≥ 7). Representative images of perilipin+ adipocytes in control and tungsten-exposed femur sections, 20×. *P ≤ .05, unpaired student t-test, one-tailed. C, Ex vivo MSC cultures were derived from control and tungsten-exposed mice and differentiated in the absence of tungsten in vitro. Cultures were transitioned to osteoinductive medium and were either left untreated (Control OM or Tungsten OM) or treated with 1 nM rosiglitazone (Control OM + Rosi or Tungsten OM +Rosi) throughout adipocyte differentiation. RNA expression analysis of adipogcyte gene markers (Pparg, Fabp4, Plin1, and Adipoq) in ex vivo MSC cultures analyzed by qRT-PCR at day 7 of differentiation. Graph shows the mean fold change in gene expression ± SEM (n = 3), normalized to naïve gene expression for each gene. Table shows the mean fold change in gene expression ± SEM (n = 3) for Control and Tungsten samples cultured in OM media alone, normalized to naïve gene expression for each gene. Graphs **P ≤ .01 1-way ANOVA. Table *P ≤ .05, **P ≤ .01 unpaired student t test, 1-tailed. D, Adipocyte quantification in ex vivo MSC cultures was analyzed by counting the number of adipocytes in 3 representative images (10×) of Oil Red O stained cells per sample at day 9 of differentiation. Graph shows the number of adipocytes ± SEM (n = 6). *P ≤ .05 1-way ANOVA.


