FIG. 4.
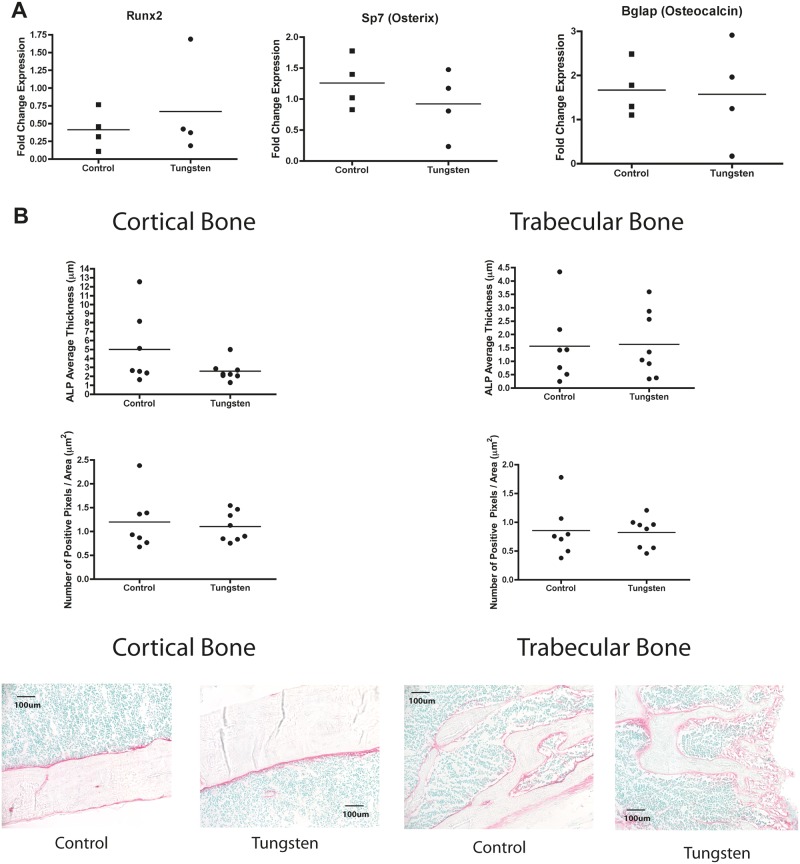
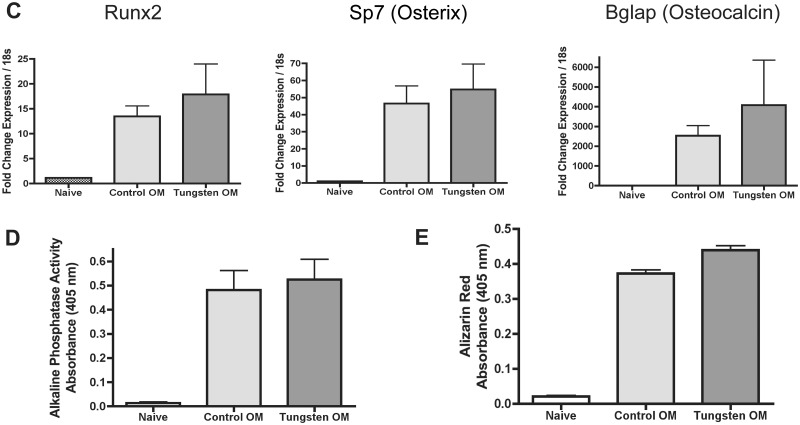
Tungsten does not inhibit osteogenesis in vivo A, RNA expression analysis of osteogenic gene markers Runx2, Sp7, and Bglap in total bone marrow isolated from control and tungsten-exposed animals, analyzed by qRT-PCR. Graph shows mean fold change in gene expression normalized to one control sample (n = 4). Data normalized to housekeeping genes Gapdh and m36B4. B, Analysis of ALP activity in sections of tibia bone tissue from control and tungsten-exposed animals. Graphs show the average ALP staining thickness (μm)/animal and the number of positive pixels/analyzed region area (μm2)/animal (n ≥ 7). Representative images of ALP staining in cortical (left) and trabecular (right) bone regions from control and tungsten-exposed tibia sections, 20×. C, Ex vivo cultures were isolated from control and tungsten-exposed mice and differentiated in the absence of tungsten in vitro. MSC cultures were transitioned to OM medium throughout differentiation (Control OM or Tungsten OM). RNA expression analysis of osteogenic gene markers (Runx2, Sp7, and Bglap) in ex vivo MSC cultures analyzed by qRT-PCR at day 10 of differentiation. Graph shows the mean fold change in gene expression ± SEM (n = 3), normalized to naïve gene expression for each gene. D, ALP activity was measured in ex vivo MSC cultures on day 12 of differentiation. Graph shows the mean level of ALP activity (absorbance) ± SEM for naïve, Control OM, and Tungsten OM samples (n = 6). E, Calcium mineralization was measured by Alizarin Red staining in ex vivo MSC cultures at day 12 of differentiation. Graph shows the mean level of Alizarin Red dye (absorbance) ± SEM for naïve, Control OM, and Tungsten OM samples (n = 6).


