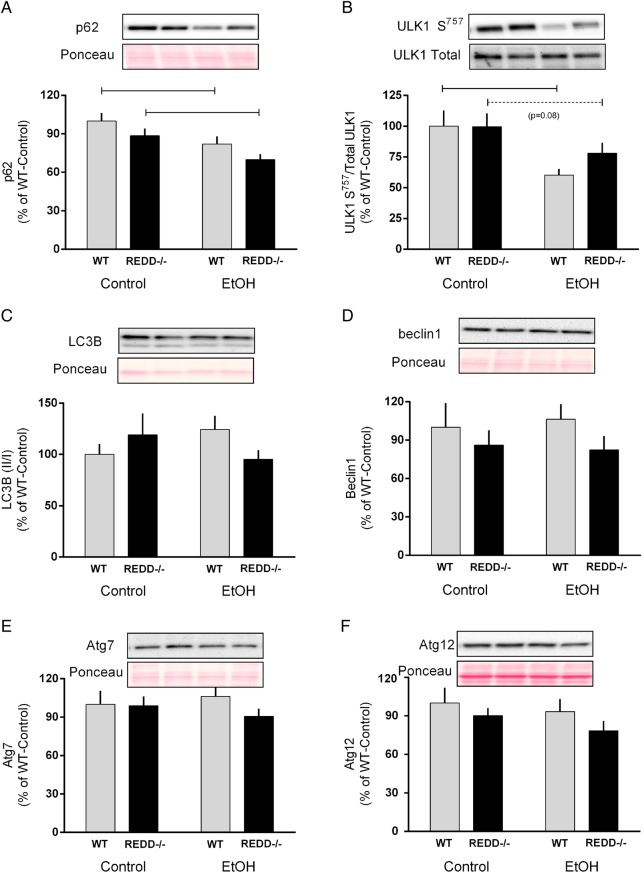
Fig. 5.
Markers of autophagy were assessed in wild-type (WT) and REDD1−/− mice after acute alcohol intoxication. Indicators of autophagy including p62 (A), ULK-1 S757 (B), LC3B (C), beclin1 (D), Atg7 (E) and Atg12 (F) were quantified from western blot images and are expressed relative to the total amount of the respective protein when available. Where the corresponding total protein was not measured, Ponceau S stain was used to verify loading. Gray bars represent WT and black bars correspond to REDD1−/− mice. Lanes shown in the representative image correspond to the order in the graph. All values are expressed relative to control-WT which was set to 100%. Horizontal bars indicate statistical differences between groups (P < 0.05). WT-Con, n = 10; WT-EtOH, n = 15; REDD1−/−-Con, n = 18; REDD1−/−-EtOH, n = 20. Values are expressed as means ± SE.

