
Fig. 4. Quantitative analysis of an infiltrative tumor margin imaged with SRS microscopy.
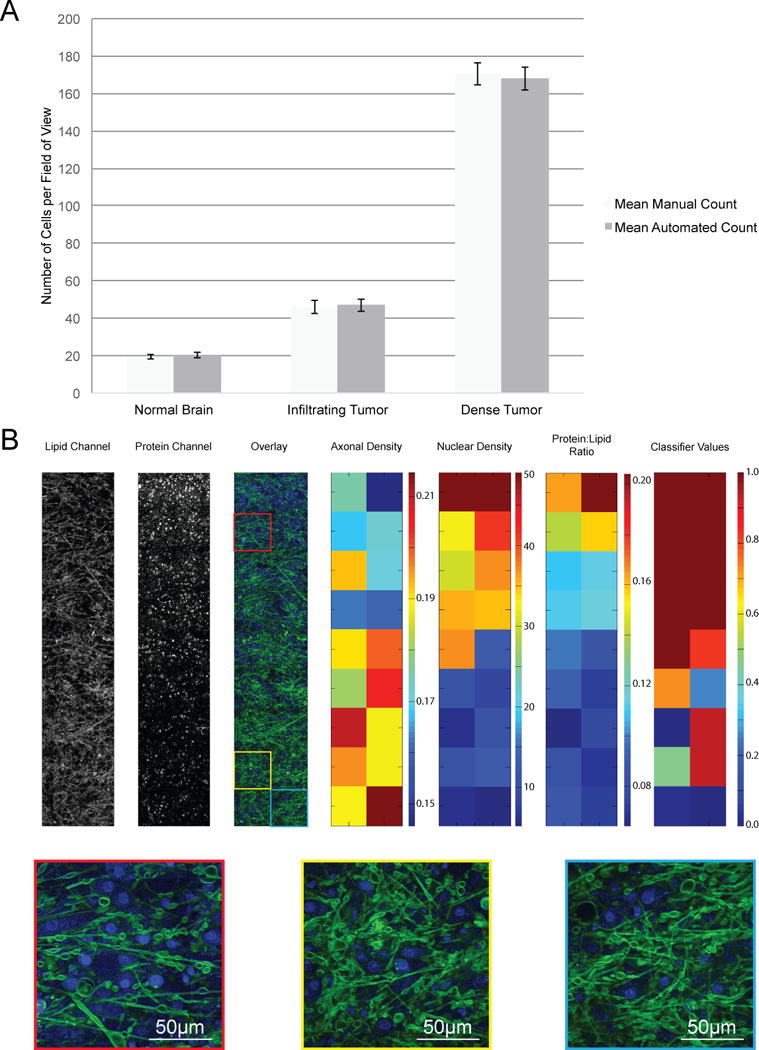
(A) Cellularity was quantified manually and with automated methods in 20 representative fields of view, drawn from 6 patients with varying degrees of tumor infiltration (2 controls without tumor infiltration, 2 with infiltrating tumor and 2 with dense tumor infiltration). Data are averages ± SEM (B) The variability in cellularity, axonal density, protein:lipid raio, and classifier values at a brain tumor margin. SRS microscopy lipid and protein channels were overlaid. Heat maps show calculated axon densities (arbitrary units) for all FOVs, nuclei per FOV, calculated protein:lipid ratio for all FOVs, and classifier values for all FOVs. Insets are FOVs with high (red), average (yellow), and low (blue) classifier values.