
Fig. 6. SRS microscopy within and surrounding a glioblastoma.
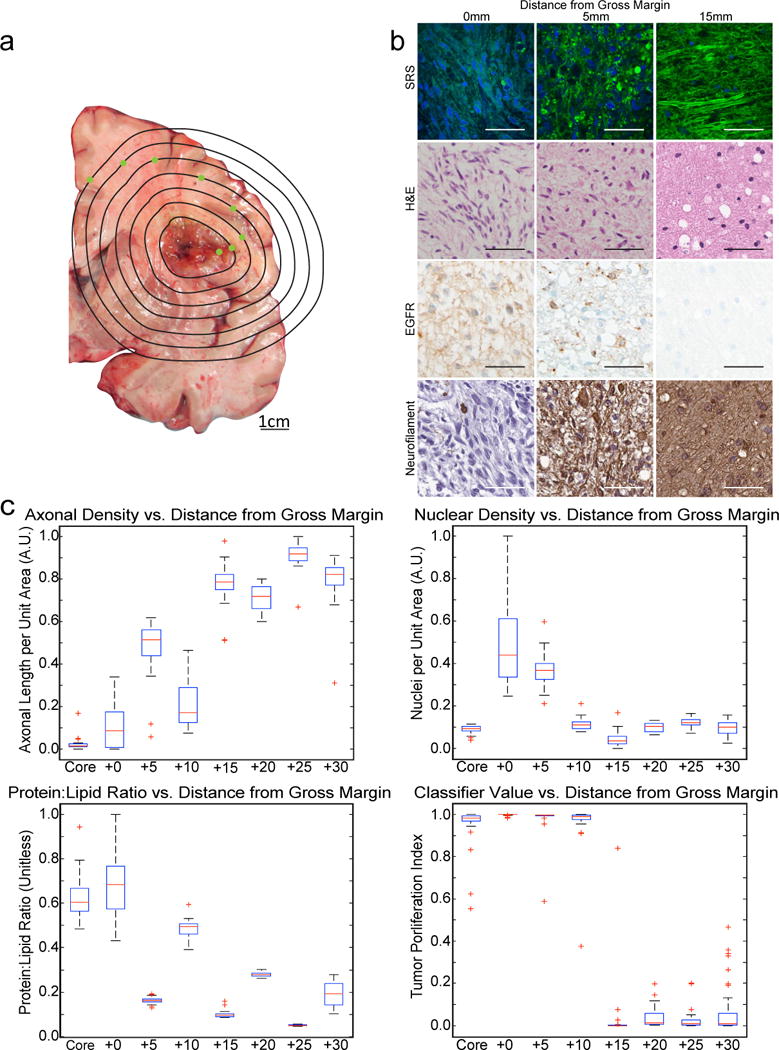
(A) A coronal slice of cadaveric brain from a patient who expired with glioblastoma was sampled at the points indicated in green, shown along 5-mm iso-distance lines (as measured from the tumor margin). (B) FOVs captured from the gross tumor margin (0 mm), 5 mm outside the tumor margin (center), and 15 mm outside the tumor margin reveal dense tumor, infiltrating tumor, and normal tissue by SRS, H&E staining, EGFR immunohistochemistry, and neurofilament immunostaining. Scale bars, 50 μm. (C) Tukey boxplots showing quantified axonal density, nuclear density, protein:lipid ratio, and classifier values for all FOVs taken from the necrotic tumor core, viable tumor edge, and at 5-mm increments from 5–30 mm from the gross tumor margin (n = 8). Outlier cutoff defined as median ±1.5 interquartile range.