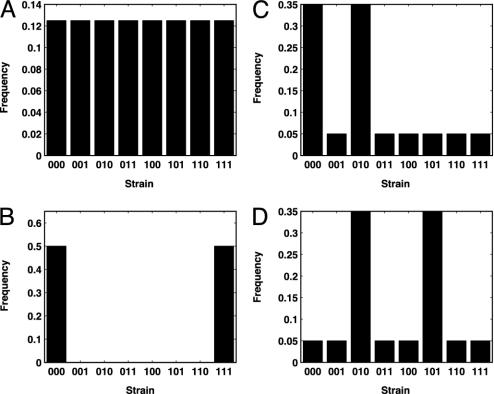
Fig. 1.
Strain histograms illustrating diversity and discordance metrics. In this example, with a three-allele pathogen, eight possible strains can exist in a population at any point in time (each consisting of a unique combination of three immunodominant loci). Populations in A and B both have the same discordance value (H = 0.5), but population in A has a more diverse distribution of strains present (D = 1.0) than population in B (D = 0.33). Populations in C and D, although having identical diversity levels (D = 0.79), differ in the extent of the allelic similarities of the strains present, with population in D having a higher discordance level (H = 0.68) than population in C (H = 0.51).

