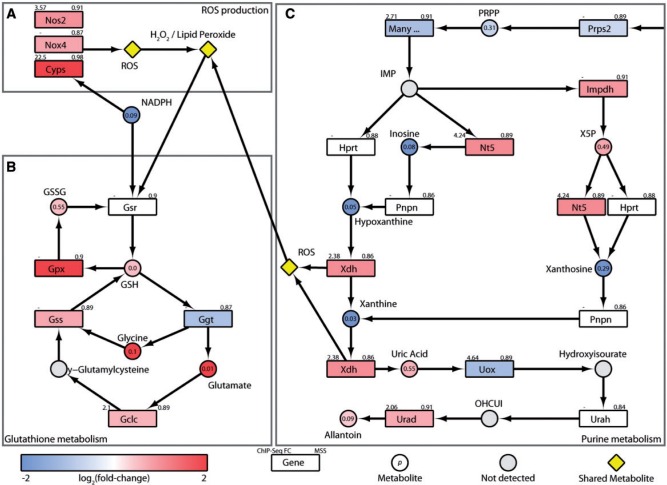
FIG. 2.
Induction of oxidative stress and defense pathways. Integration of transcriptomic, hepatic and serum metabolomic, and KEGG pathway data for (A) ROS producing xenobiotic metabolizing enzymes, (B) Glutathione metabolism, and (C) Purine metabolism. Color scale represents the log2(fold-change) for genes and metabolites. Yellow symbols indicate converging metabolites. Gray symbols indicate metabolites not measured or detected. Genes are identified as rectangles and metabolites as circles. The upper left corner indicates maximum AhR enrichment fold-change and upper right corner indicates the highest scoring pDRE matrix similarity score (MSS). Circles contain the P-value for metabolite changes. An expandable and interactive version of this figure with further information is available at http://dbzach.fst.msu.edu/index.php/supplementarydata.html.

