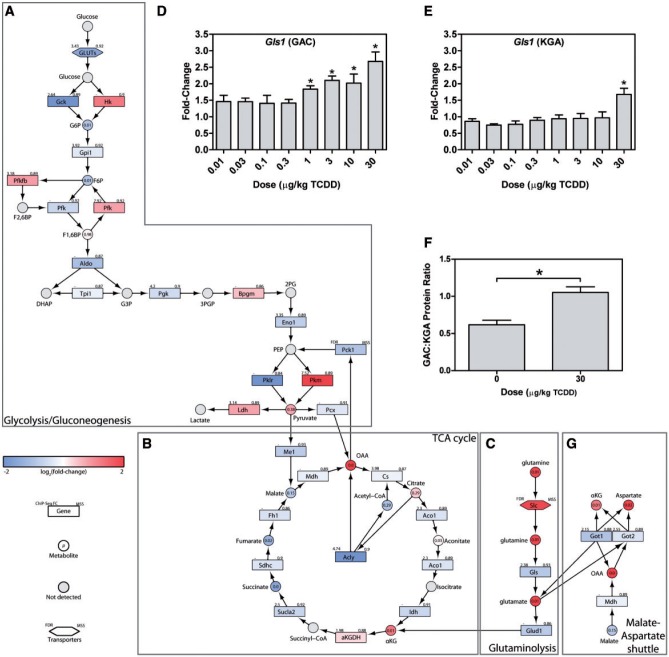
FIG. 3.
Reprogramming of central carbon and amino acid metabolism. Integration of transcriptomic, hepatic and serum metabolomic, and KEGG pathway data for (A) glycolysis/gluconeogenesis, (B) the TCA cycle, (C) glutaminolysis. QRTPCR confirmation of hepatic Gls1 (D) GAC, and (E) KGA isoforms, as well as (F) the GAC:KGA protein ratio are shown as barplots. (G) Transcriptomic, metabolomic, and KEGG pathway data were integrated for the malate-aspartate shuttle. In integrative pathways, the color scale represents the log2(fold-change) for genes and metabolites. Gray indicates metabolites not measured or detected. Genes are identified as rectangles, metabolites as circles, and transporters as hexagons. The upper left corner provides the maximum AhR enrichment fold-change and upper right corner indicates the highest pDRE matrix similarity score (MSS). Circles contain the P-value for detected metabolites. An expandable and interactive version of this figure which provides additional information can be viewed at http://dbzach.fst.msu.edu/index.php/supplementarydata.html. Bars in barplots represent mean + SEM. Asterisks (*) indicate P ≤ .05 compared with vehicle determined by 1-way ANOVA followed by Dunnett’s post hoc test.

