Fig. 4.
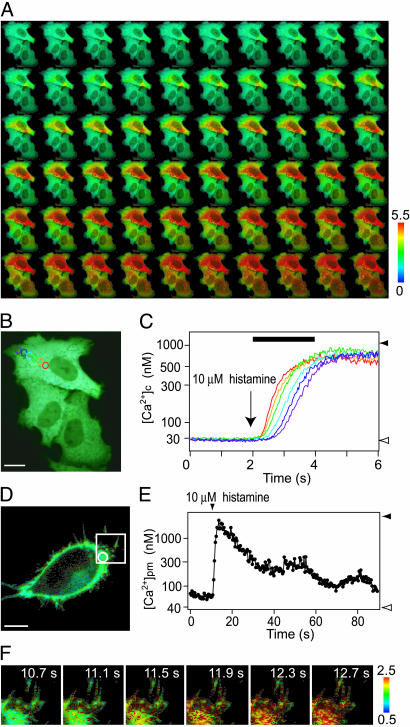
Confocal Ca2+ imaging in cytosol and beneath the plasma membrane by using YC3.60 and YC3.60pm, respectively. (A) A series of confocal pseudocolored ratio images showing propagation of [Ca2+]c. These images were taken at video rate. (B) A real-color image of the HeLa cells. In the top cell, six regions of interest (ROIs) were placed for measuring the propagation speed. (Scale bar = 10 μm.) (C) Time courses of changes in [Ca2+]c in the six ROIs indicated in B. Rmax and Rmin are indicated by a solid and an open arrowhead, respectively. The left-hand ordinate calibrates [Ca2+]c in nM. A black horizontal bar indicates the time during which the ratio images are shown in A. (D) A real-color image of a HeLa cell expressing YC3.60pm. (Scale bar = 5 μm.) (E) The histamine-induced change in [Ca2+]pm in the peripheral region indicated by a circle in D. Rmax and Rmin are indicated by a solid and an open arrowhead, respectively. The left-hand ordinate calibrates [Ca2+]pm in nM. (F) A series of confocal pseudocolored ratio images showing changes in [Ca2+]pm in filopodial structures.

