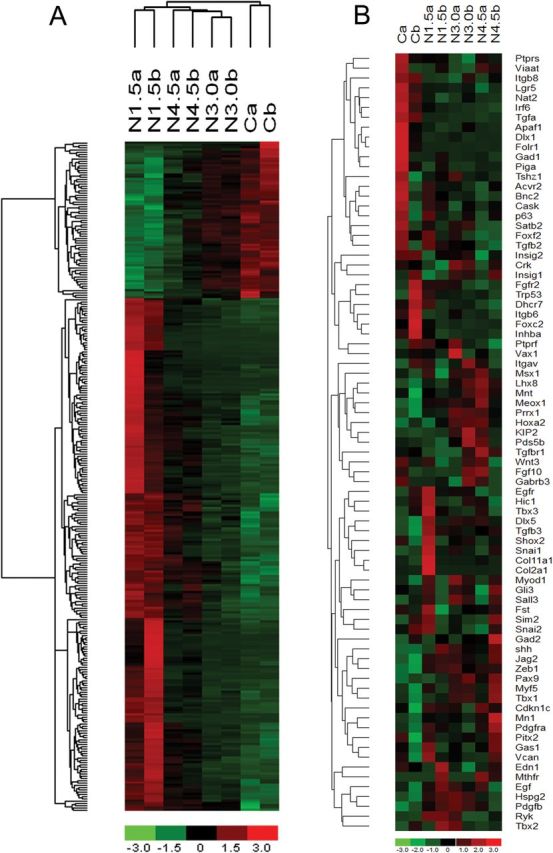
Figure 3.

Hierarchical clustering (heatmap) analysis of differentially expressed transcripts. Unsupervised hierarchical clustering of the expression of probe sets differentially expressed in the nicotine-treated versus control pups. (A) Complete transcriptional profile of progressively up-regulated (n = 69) and down-regulated (n = 227) genes. (B) Significantly up-regulated (n = 18) and down-regulated (n = 20) genes known to be susceptible for induction of cleft palate (n = 84). Nicotine-treated pups cluster primarily into three distinct groups on a dose-dependent manner. Each column corresponds to the expression profile of a treatment (either nicotine [N] or saline [C]) in duplicates, and each row corresponds to an mRNA. Upper portion (green-to-red) represents down-regulated transcripts and lower portion (red-to-green) represents up-regulated transcripts in A and vice versa in B. The increasing intensities of red signify a higher expression in the given sample of a specific mRNA, whereas the increasing intensities of green indicate a lower expression of mRNA and black indicates mean level expression.
