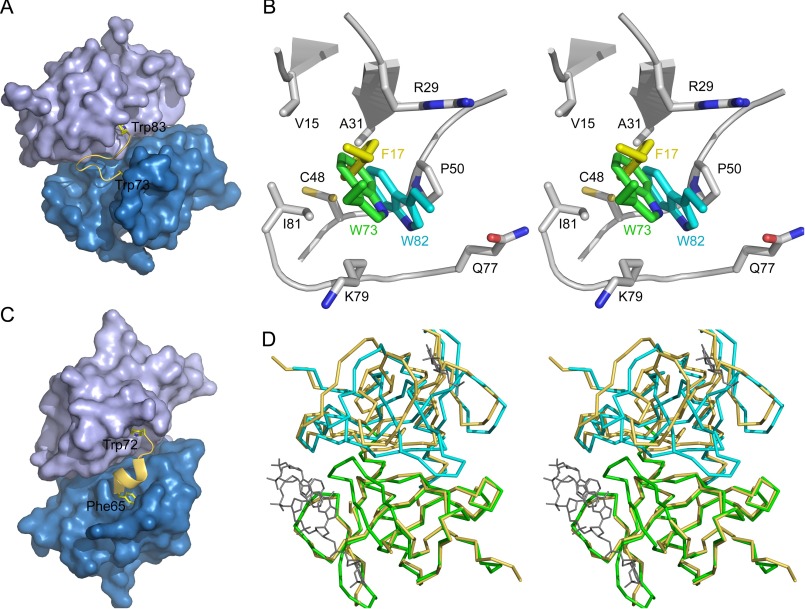
FIGURE 7.
Parallels between EcMazF and CcdB. A, surface of the EcMazF dimer in the complex with EcMazE(68–82). The two EcMazF monomers are shown in different shades of blue. The EcMazE(68–82) peptide is shown in a yellow schematic representation, with the side chains of Trp-73 and Trp-82 highlighted. B, stereo view of the hydrophobic pocket accommodating EcMazE Trp-73 and Trp-82. The side chains of Val-15, Arg-29, Ala-31, Cys-48, Pro-50, Gln-77, Lys-79, and Ile-81 of EcMazF (chain A of PDB entry 5CQX) are shown in stick representation colored by atom type. The local backbone conformation is shown in schematic representation. The side chain of Trp-73 of EcMazE(68–82), which docks into this pocket, is shown in green. The side chain of EcMazE(68–82) Trp-82 (resulting from a superposition of chain B on chain A of the EcMazE(68–82) complex) is shown in cyan. EcMazF residue Phe-17 (superimposed from the d(AUACAUA) complex) is shown in yellow. C, surface of the F-plasmid CcdB dimer in its CcdA-bound conformation (PDB entry 3HPW). The two CcdB monomers are shown in different shades of blue and are aligned with the EcMazF dimer in A. A yellow schematic is shown for the CcdA peptide Phe-65–Trp-72, and the side chains of Phe-65–Trp-72 are highlighted. D, stereo representation of the superposition of the Cα traces of the EcMazF dimer in its EcMazE(68–82)-bound conformation (green and cyan) and its d(AUACAUA)-bound conformation (yellow). The bound d(AUACAUA) is shown in gray to identify the substrate binding region. Only one monomer was used to calculate the superposition. A clear relative rigid body displacement of both monomers relative to each other is seen, which moves helix α1 relative to the other three loops that together form the substrate-binding site.

