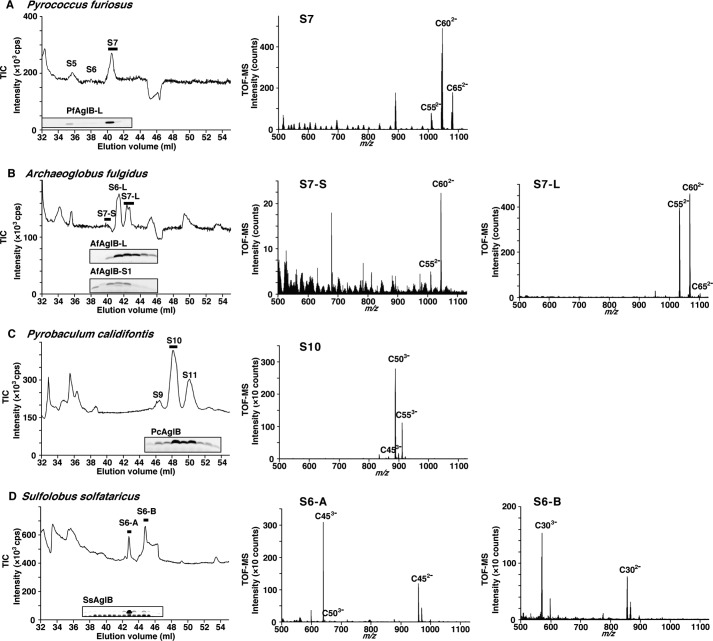
FIGURE 2.
Normal phase LC-ESI-MS analyses of LLOs from four archaeal species. The total lipid extracts of P. furiosus (A), A. fulgidus (B), P. calidifontis (C), and S. solfataricus (D) were analyzed. The TIC of the ESI-MS analyses, and the TOF-MS spectra averaged from the mass scans acquired during the time period indicated by the horizontal thick bars in the TICs are shown. The symbol S in the TICs denotes the number of monosaccharide residues. The fluorescence images of the SDS-PAGE gels in the TICs are the results of the oligosaccharyl transfer assay. The bands in the gel images are the glycopeptides produced, and their intensities are proportional to the amounts of LLO in the NPLC fractions. Note that a contrast-enhanced fluorescence image of the SDS-PAGE gel is provided in D to shown the faint glycopeptide band corresponding to the S6-B peak.

