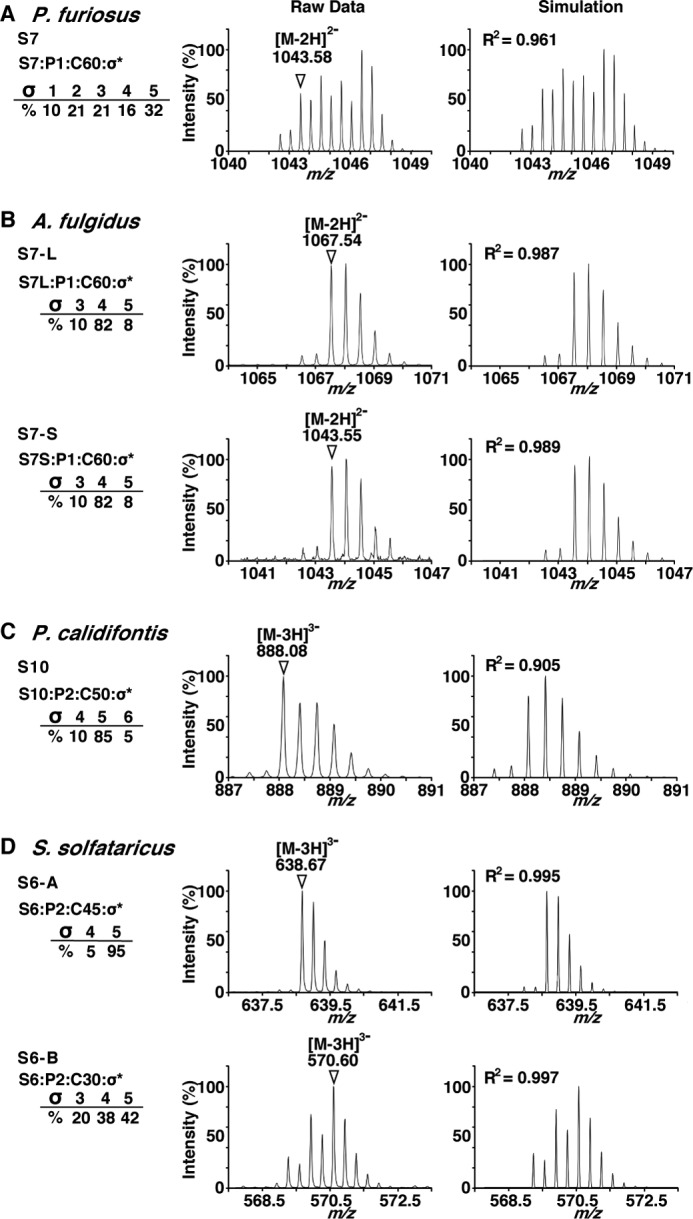
FIGURE 3.

Expansion of the selected TOF-MS ion peaks and comparison with simulated MS spectra. Shown are the raw and simulated ion peaks of P. furiosus (A), A. fulgidus (B), P. calidifontis (C), and S. solfataricus (D). The most intense ion peaks in the TOF-MS spectra in Fig. 2 were selected, and the expansions of the ion peaks are displayed in the left column. The chemical structure of the ion peaks is represented as Si:Pj:Ck:σl, where i is the number of sugar residues, j is the number of phosphate groups, k is the number of carbon atoms of the dolichol moiety, and l is the number of saturated isoprene units. The ions used in the MS/MS analyses (Fig. 4) are indicated by triangles with their m/z values. The simulated MS spectra are shown in the right column, to account for the mixed states of the dolichol species with different degrees of isoprene saturation. The R2 values of the peak intensity correlation between the raw and simulated mass spectra were calculated. Note that the saturation number includes the saturation of the double bond in the α-isoprene unit, which is the signature for the definition of dolichol.
