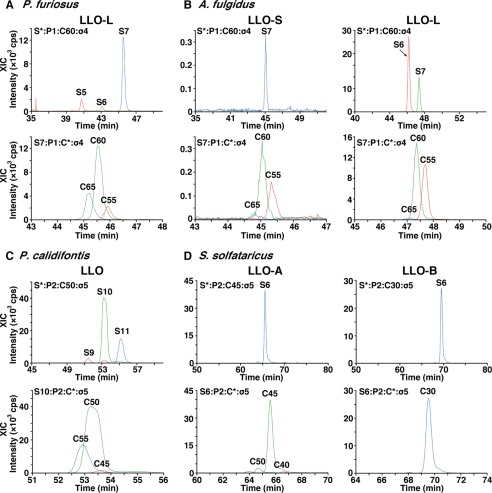
FIGURE 6.
Normal phase LC XIC profiles for the estimation of the compositions of the LLO species. The original data are shown in Fig. 2. Ions with different numbers of monosaccharide residues (S-5–S-11) or different numbers of carbons in the dolichol moiety (C-30–C-65) were selected to show the XIC profiles of the LLO species from P. furiosus (A), A. fulgidus (B), P. calidifontis (C), and S. solfataricus (D). The peak intensities were used to estimate the compositions of the LLO species in terms of the number of monosaccharide residues and the length of the dolichol chain.

