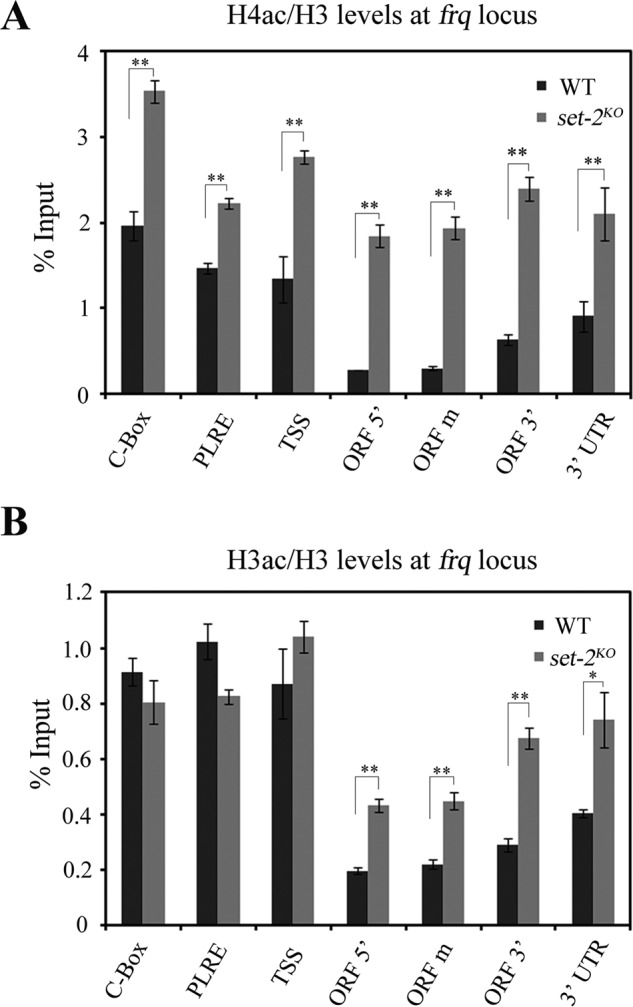
FIGURE 4.

SET-2 directs the histone acetylation state of frq ORF. ChIP analyses of H4ac (A) and H3ac (B) occurring at the frq locus. Both H4ac and H3ac levels at frq ORF region are increased in set-2KO strains compared with wild-type. ChIP experiment was performed on chromatin isolated at DD16.The amount of DNA associated with H4ac or H3ac was determined by qPCR. Significance was assessed by using a two-tailed t test. *, p < 0.05; **, p < 0.01. Error bars show the mean ± S.D. (n = 3).
