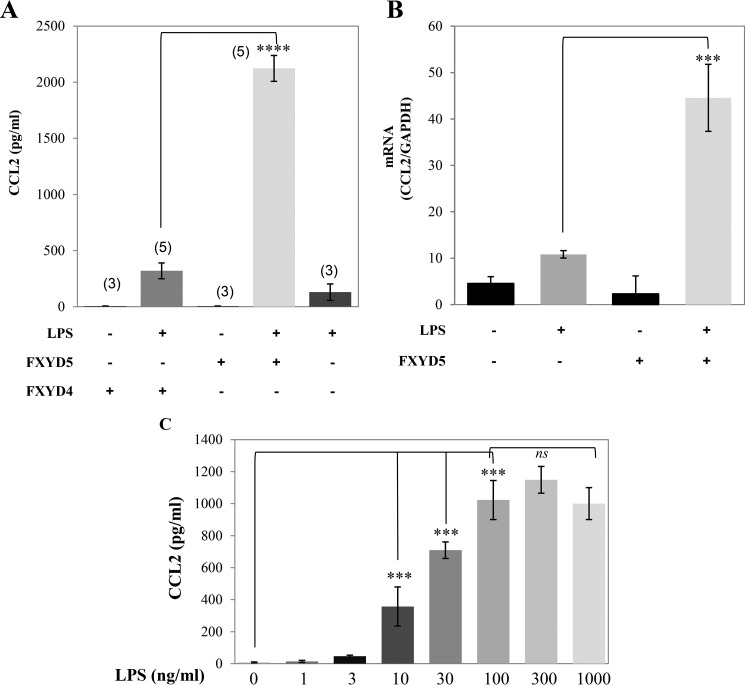
FIGURE 1.
FXYD5 increases LPS-induced CCL2 secretion in M1 cells. Wild type, M1+FXYD5, and FXYD4 silenced M1 cells were treated with either 100 ng/ml LPS or diluent. A, medium was removed 24 h later and assayed for CCL2 as described under “Experimental Procedures.” Means ± S.E. of at least three independent experiments are depicted. The asterisk indicates a significant difference between the two test groups, as analyzed by ANOVA; ****, p < 0.0001, ns, non-significant. B, cells were lysed, total RNA extracted, and assayed for the abundance of CCL2 and GAPDH mRNA by RT-PCR as described under “Experimental Procedures.” Data are represented by arbitrary units normalized to GAPDH. Means ± S.E. of at least three independent experiments are depicted. The asterisk indicates a significant difference between the two test groups, as analyzed by ANOVA; ***, p < 0.001. C, M1+FXYD5 cells were incubated with LPS with the indicated concentration for 24 h. CCL2 secretion was quantified as described above. Means ± S.E. of at least three independent experiments are depicted. The asterisk indicates a significant difference between the two test groups, as analyzed by ANOVA; ****, p < 0.0001.

