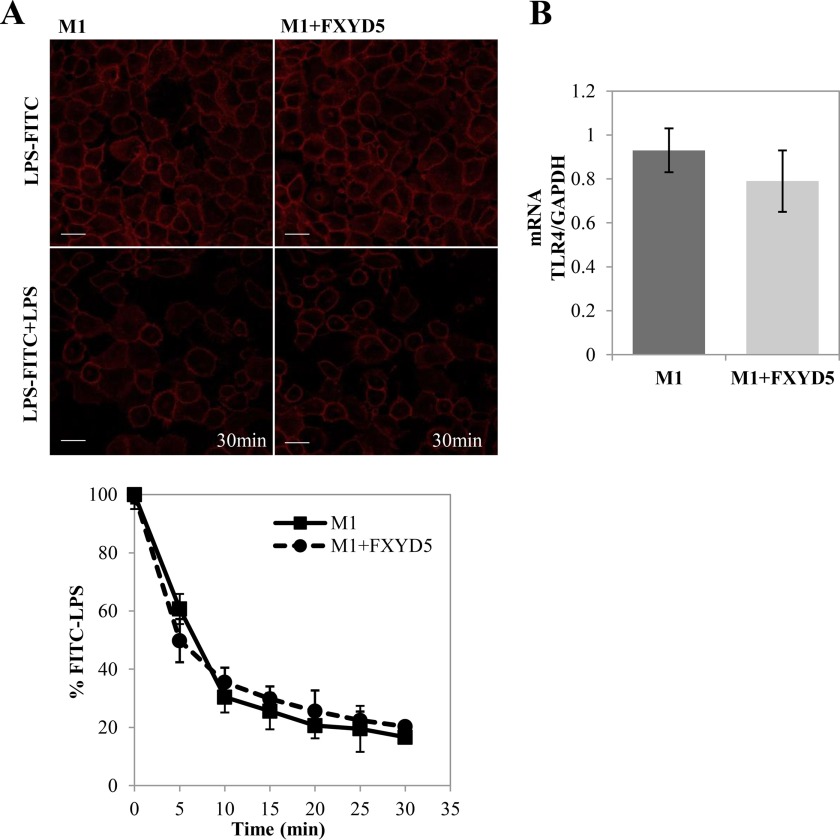
FIGURE 2.
LPS-FITC binding to M1 cells. A, M1 WT and M1+FXYD5 cells were incubated for 30 min with FITC-LPS. Non-fluorescent LPS was added and competitive kinetics were observed by fluorescent signal decay under confocal microscopy (×20 magnification). Representative images of 0 min and 30 min time points are depicted (left panel). Scale bar, 10 μm. Total fluorescence of each image was calculated and plotted (bottom). Data points are means ± S.E. of 4 fields for each cell type. B, M1 WT and M1+FXYD5 cells were lysed, total RNA extracted, and assayed for the abundance of TLR4 mRNA by RT-PCR as described under “Experimental Procedures.” Data represented by arbitrary units normalized to GAPDH. Means ± S.E. of three experiments are depicted.

