FIGURE 6.
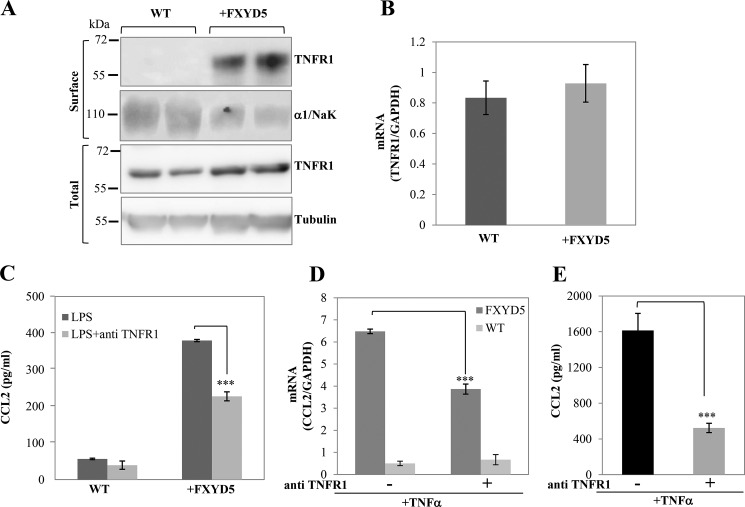
FXYD5 promotes plasma membrane expression of TNFR1. A, M1 and M1+FXYD5 were surface labeled with biotin, and total and surface-biotinylated proteins were extracted as described under “Experimental Procedures.” Western blots were analyzed with TNFR1-specific antibody. Tubulin and α1 subunit of Na,K-ATPase (α1/NaK) are shown as the loading controls for the total and surface expressed proteins, respectively. Two independent protein preparations from WT and M1+FXYD5 cells are depicted. B, RT-PCR was performed to measure TNFR1 mRNA abundance. Data are represented by arbitrary units normalized to GAPDH. C, CCL2 secretion following treatment with TNFR1 blocking antibody. Prior to LPS treatment, WT M1 and M1+FXYD5 cells were incubated for 1 h with 10 μg/ml TNFR1 blocking antibody or diluent. Medium was removed, and 0.5 ml of fresh medium was added ± 100 ng/ml LPS and incubated for 8 h. Medium was removed, and aliquots were analyzed for secreted CCL2. Means ± S.E. of three different experiments are depicted. The asterisk indicates a significant difference between the two test groups, as analyzed by ANOVA, ***, p < 0.001. D, following TNFα stimulation, anti-TNFR1 treated (TNFα+ab) and non-treated (TNFα) cells were lysed, total RNA extracted and assayed for the abundance of CCL2 mRNA by RT-PCR as described under “Experimental Procedures.” Data represented by arbitrary units normalized to GAPDH. Means ± S.E. of three experiments are depicted. The asterisk indicates a significant difference between the two test groups, as analyzed by ANOVA; ***, p < 0.001. E, CCL2 secretion following treatment with TNFR1-blocking antibody. Prior to TNFα treatment, M1+FXYD5 cells were incubated for 1 h with 10 μg/ml TNFR1 blocking antibody or diluent. Medium was removed, and 0.5 ml of fresh medium was added +100 ng/ml TNFα and incubated for 8 h. Medium was removed, and aliquots were analyzed for secreted CCL2. Means ± S.E. of three different experiments are depicted. The asterisk indicates a significant difference between the two test groups, as analyzed by ANOVA; ***, p < 0.001.

