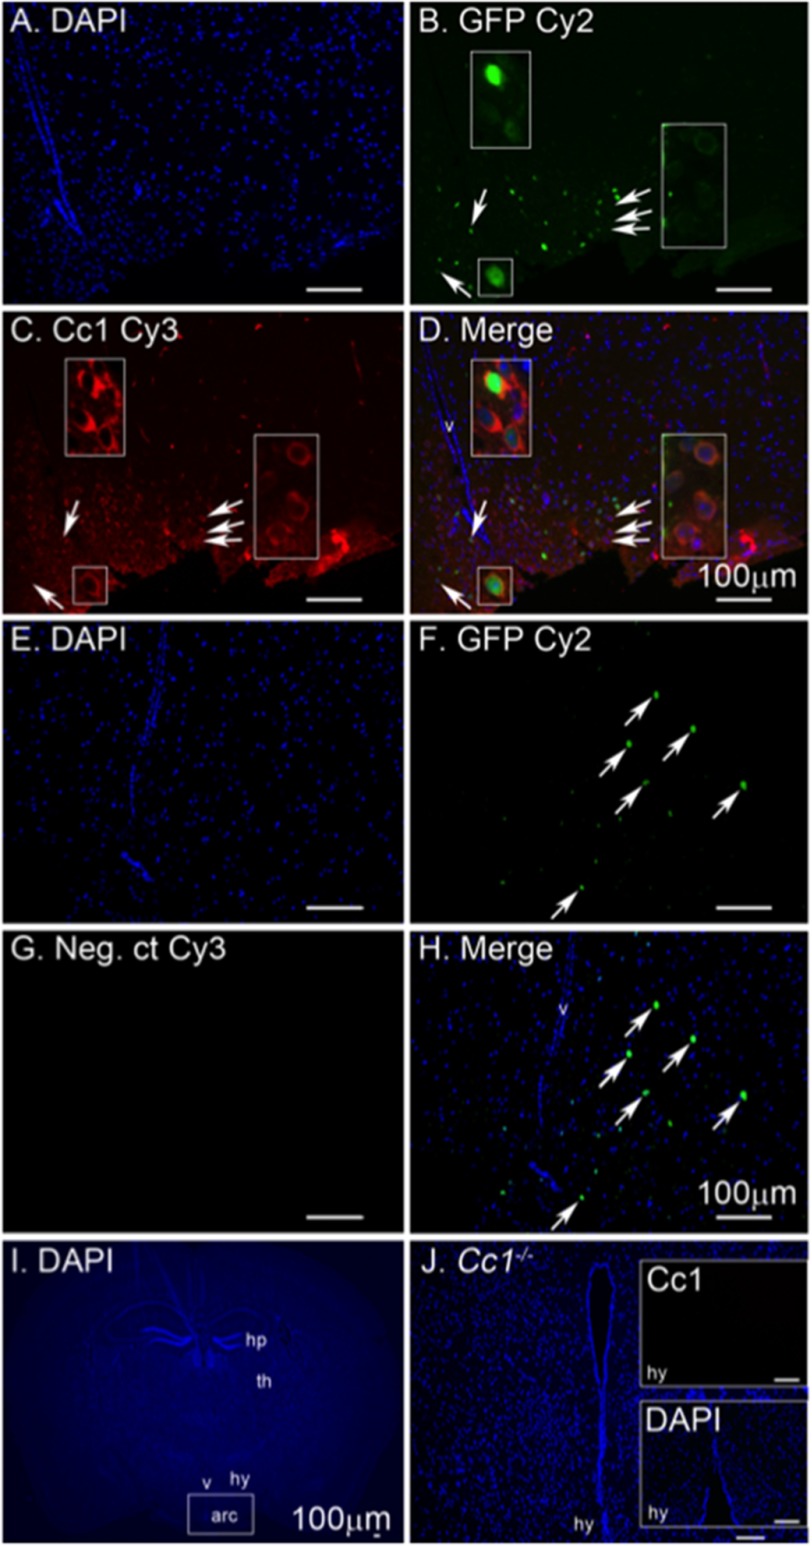
FIGURE 7.
Immunofluorescence analysis of CEACAM1 in hypothalamic POMC cells. Coronal brain sections of POMC-GFP mice were sectioned, and the arcuate nucleus was analyzed by immunofluorescence to detect nuclei in DAPI (A, E, and I). GFP-labeled POMC neurons are in green (B and F), and CEACAM1 is shown in red (C). D, merged image of POMC-GFP and CEACAM1. G shows a negative control (Neg. ct) for secondary antibody in the absence of primary antibodies. Sections from Cc1−/− mouse (I and J) show negative control for primary antibody with a magnified view of the arcuate (arc) nucleus in the inset (J). Arrows point to neurons magnified in the inset (B–D) or cells positive for GFP (F and H). Abbreviations used are as follows: v, lateral ventricle; hy, hypothalamus; th, thalamus; and hp, hippocampus. Scale bar, 100 μm.

