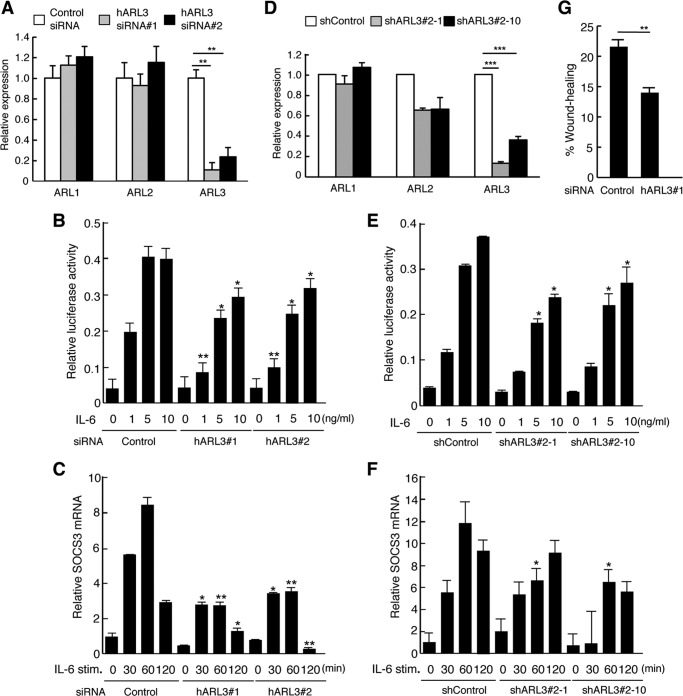
FIGURE 3.
ARL3 enhances the transcriptional activity of STAT3 after IL-6-stimulation. A, HeLa cells in a 24-well plate were transfected with control, huARL3#1, or huARL3#2 siRNAs (20 pmol). Total RNA was extracted at 48 h post-transfection, and target mRNA levels were quantified by qPCR. Data represent the levels of target mRNA normalized to that of a G3PDH internal control and are expressed relative to the value of control siRNA-treated samples. The results are representative of three independent experiments, and the error bars represent the S.D. **, p < 0.01. B, HeLa cells in a 24-well plate were transfected with control, huARL3#1, or huARL3#2 siRNAs (20 pmol), and then transfected with STAT3-LUC (100 ng). At 24 h after transfection, cells were left untreated or treated with IL-6 for an additional 12 h. The cells were harvested and assayed for the luciferase activity. Relative luciferase activity represents the ratio of Firefly and Renilla luciferase activity for each sample. Data are representative of at least three independent experiments. Error bars represent the S.D. *, p < 0.05; **, p < 0.01. C, HeLa cells in a 24-well plate were transfected with control, huARL3#1, or huARL3#2 siRNAs (20 pmol). At 48 h after transfection, cells were treated with IL-6 (10 ng/ml) for the indicated periods. Total RNA samples isolated from these cells were also quantified by qPCR analysis. Data represent the levels of SOCS3 mRNA normalized to that of a G3PDH internal control and are expressed relative to the value of control siRNA-treated samples. The results are representative of three independent experiments, and the error bars represent the S.D. *, p < 0.05; **, p < 0.01. D, total RNAs from HeLa shControl, shARL3#2-1, or shARL3#2-10 cells were extracted at 48 h post-transfection, and target mRNA levels were quantified by qPCR. Data represent the levels of target mRNA normalized to that of a G3PDH internal control and are expressed relative to the value of control siRNA-treated samples. The results are representative of three independent experiments, and the error bars represent the S.D. ***, p < 0.001. E, HeLa shControl, shARL3#2-1, or shARL3#2-10 cells in a 24-well plate were transfected with STAT3-LUC (100 ng). At 24 h after transfection, cells were left untreated or treated with IL-6 for an additional 12 h. The cells were harvested and assayed for the luciferase activity. Relative luciferase activity represents the ratio of Firefly and Renilla luciferase activity for each sample. Data are representative of at least three independent experiments. Error bars represent the S.D. *, p < 0.05. F, HeLa shControl, shARL3#2-1 or shARL3#2-10 cells in a 24-well plate were treated with IL-6 (10 ng/ml) for the indicated periods. Total RNA samples isolated from these cells were also quantified by qPCR analysis. Data represent the levels of SOCS3 mRNA normalized to that of a glyceraldehyde-3-dehydrogenase (G3PDH) internal control and are expressed relative to the value of control siRNA-treated samples. The results are representative of three independent experiments, and the error bars represent the S.D. *, p < 0.05. G, HeLa cells in a 24-well plate were transfected with control or huARL3#1 siRNAs (20 pmol). 48 h after siRNA-transfected cells were plated, and an artificial wound was created in the cell monolayer. Cells migrating into the open space from the wound edge were quantified. Data are representative of four independent experiments. Error bars represent the S.D. **, p < 0.01.

