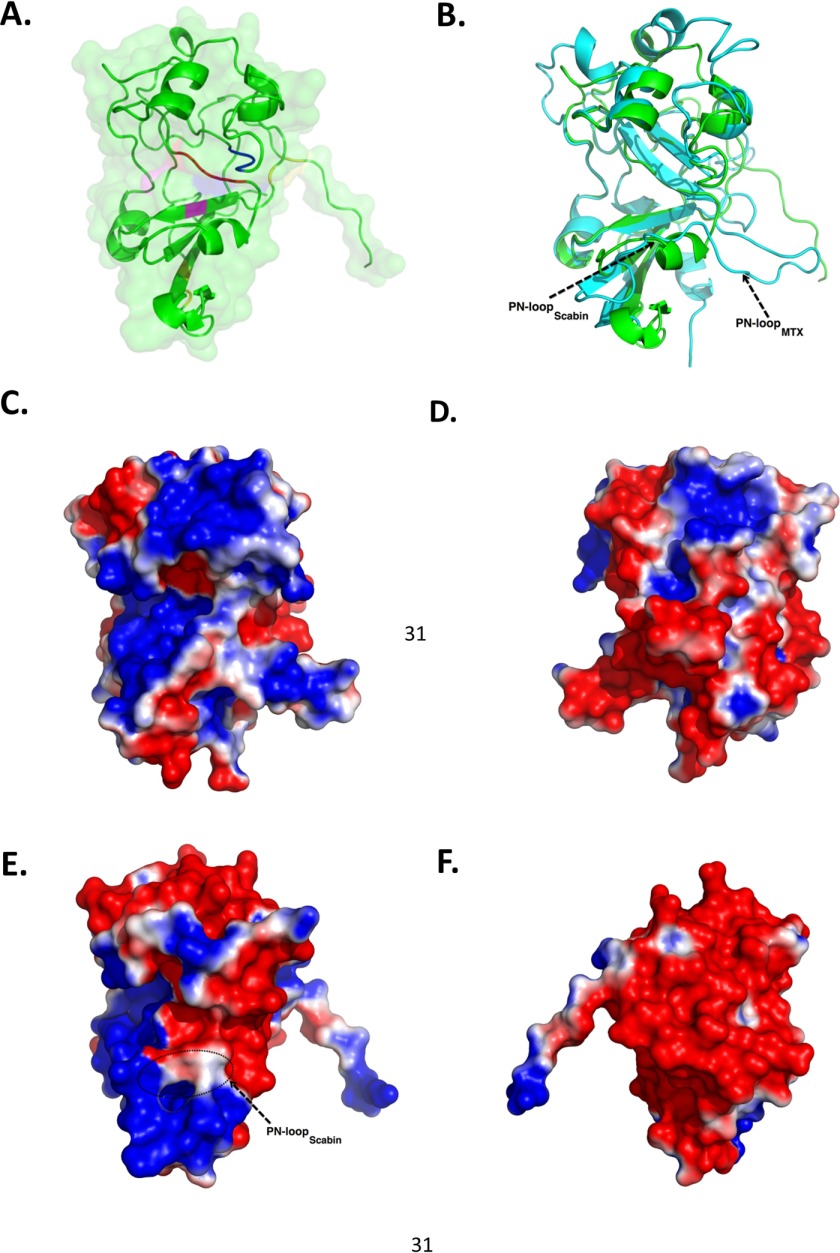
FIGURE 5.
Scabin-apo crystal structures. A, close-up of the Scabin-apo crystal structure shown as a ribbon diagram. Catalytic residues Gln158 and Glu160 are colored blue. Other important residues in the reaction mechanism, Arg77 (pink) and STS motif (red), are also highlighted. Disulfide bridges are colored yellow. B, structural comparison of Scabin-apo (green) and the catalytic domain of the MTX toxin structure (cyan) based on an iterative, three-dimensional alignment of protein backbone Cα atoms using PyMOL. C, surface potential of the catalytic subunit of MTX (front view). Molecular surfaces are colored by the relative electrostatic potential (red, negative or acidic; blue, basic or positive). Surface potentials were calculated using PyMOL APBS software. D, surface potential of the catalytic subunit of MTX toxin (back view). E, surface potential of Scabin-apo (side view). F, surface potential of Scabin-apo (opposite side view).

