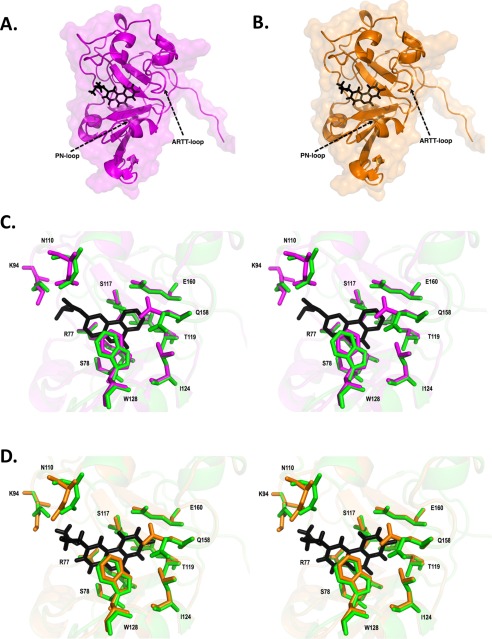
FIGURE 6.
Scabin inhibitor crystal structures. A, Scabin·PJ34 complex structure shown as a ribbon diagram. PJ34 is colored black and represented in stick format. B, Scabin·P6-E complex structure shown as a ribbon diagram. P6-E is colored black and represented in stick format. C, stereo view of active site of Scabin·PJ34 complex structure (magenta) and Scabin-apo structure (green). PJ34 is colored black and represented in stick format. Structural differences among important catalytic residues (Arg77 Ser78, Lys94, Asn110, Ser117, Thr119, Leu124, Tyr128, Gln158, and Glu160) are highlighted. D, stereo view of active site of Scabin·P6-E complex structure (magenta) and Scabin-apo structure (green). P6-E is colored black and represented in stick format. Structural differences among important catalytic residues (Arg77 Ser78, Lys94, Asn110, Ser117, Thr119, Leu124, Tyr128, Gln158, and Glu160) are highlighted.

