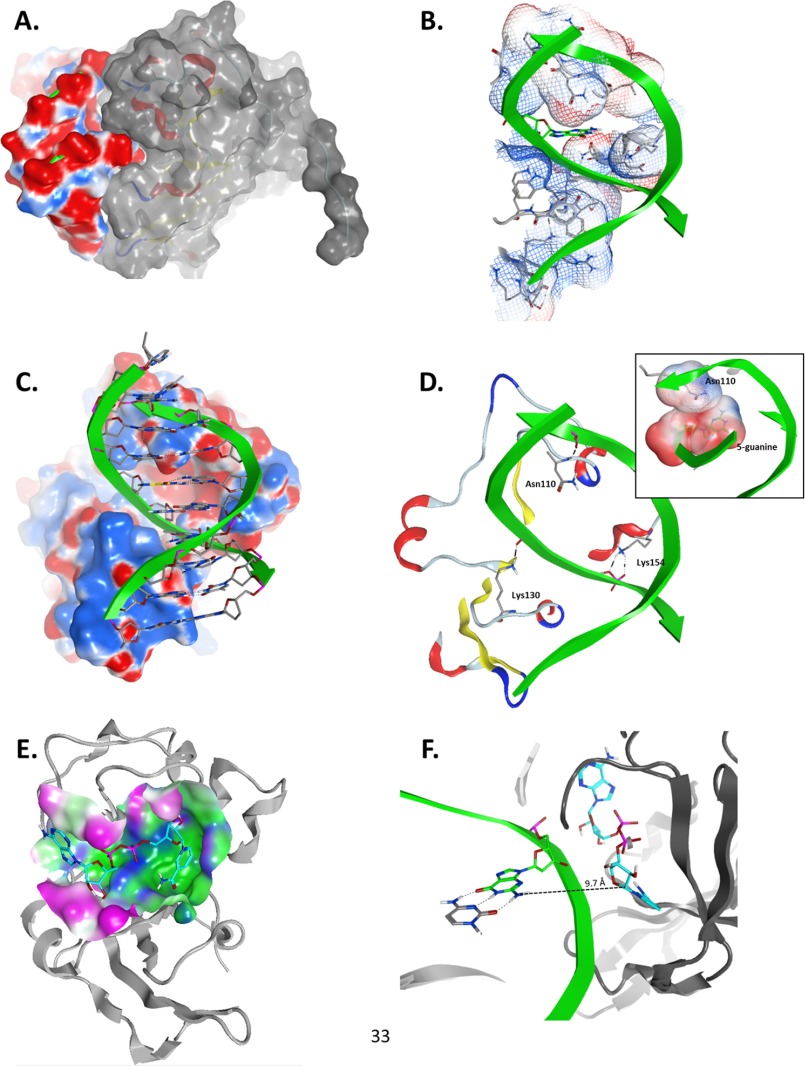
FIGURE 7.
Model of the Scabinm·NAD+·dsDNA10 complex. Panels show details of the interaction between Scabin, NAD+, and the dsDNA10 molecules from the ternary complex generated by using the Scabin-apo structure as the template. A, Scabin-DNA shape complementarity; side view of the molecular surfaces of the modeled complex of Scabin (colored with gray surface) and the 10-mer dsDNA (colored according to the electrostatic potential; red, negative; blue, positive). B, DNA-binding cleft. Front view of the van der Waals interaction surface of the active conformation of Scabin, colored by the electrostatic potential. The 5-position guanine base is depicted in green carbon atoms, whereas the protein residues making DNA contact are shown in gray carbon atoms. C, Scabin-DNA electrostatic complementarity. Shown is a front view of the complex, depicting the DNA ribose and base atoms. The molecular surface of the Scabin is colored by the electrostatic potential. D, specific Scabin-DNA interactions. Details of the H-bond interactions between three active site loop residues (Asn110, Lys130, and Lys154) in the Scabin active conformation and the phosphate backbone of the dsDNA molecule are shown. Inset, contact between the van der Waals interaction surfaces of Asn110 and the 5-position guanine. E, NAD+-binding pocket. The molecular surface of Scabin around the binding pocket of NAD+ is colored according to its polar (blue), hydrophobic (green), or exposed (fuchsia) character. The bound NAD+ substrate is shown in cyan carbon atoms, and the backbone trace of Scabin is shown in light gray ribbons. F, distance and configuration of the reactive centers. A side view of the ternary complex showing the 5-position guanine (in green carbon atoms) of the dsDNA10 and the active conformation of NAD+ (in cyan carbon atoms) are shown in the ternary complex. The drawn segmented line connects the exo-cyclic amino nitrogen atom of the 5-position guanine with the C1′ atom of the NAD+ N-ribose with a separation distance of ∼9.7 Å. Figures were rendered by MOE.

