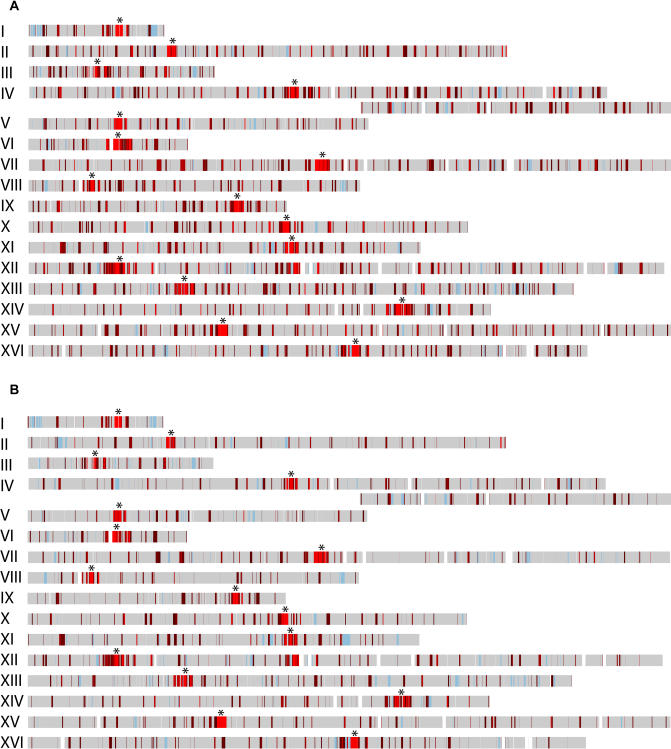
Figure 1. Microarray Analyses of Mcd1p and Smc3p Binding.
DNA isolated from cohesin subunit ChIPs and control input DNA was labeled with aminoallyl dUTP, conjugated to Cy5 (red) or Cy3 (green) fluorescent tags, and then hybridized competitively to microarrays. Although the samples were labeled by different fluorescent tags depending on the experiment, for the purposes of analysis, the ratios are converted such that the ChIP signal is represented by red and control DNA by green. The red-to-green (R:G) ratio for each ORF and intergenic region was calculated for cells arrested in mitosis using the cdc16 mutation and assigned a color, and the median value obtained for each element was then plotted on a map of the sixteen chromosomes to determine the chromosomal distribution of Mcd1–6HAp. Regions with a R:G ratio less than 1.8 are shown in gray, and those with ratios of 1.8 or higher are shown in red. The red shading is an indicator of the intensity of cohesin subunit binding, such that regions with larger R:G ratios have lighter shades of red. Hybridization data are unavailable for regions shaded in blue (see Materials and Methods), and genomic regions not present on the arrays are indicated in white. Centromere position is indicated by an asterisk.
(A) Chromatin isolated from strains containing Mcd1-6HAp (1377A1-4B, 1829-15B, and PMY270) was immunoprecipitated using anti-HA antibodies.
(B) Chromatin isolated from strains containing Smc3-6Mycp (PMY270 and 1839-3D) was immunoprecipitated with anti-Myc antibodies.

