FIGURE 10.
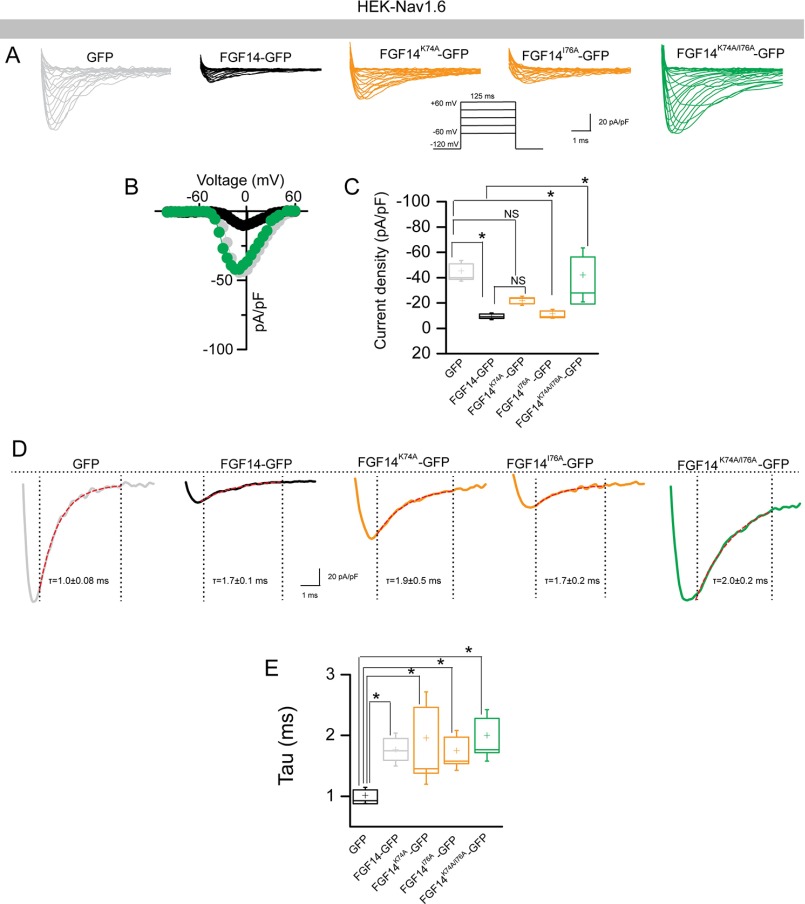
Functional validation of Lys-74 and Ile-76 in modulating Nav1.6 currents. A, representative traces of voltage-gated Na+ currents (INa+) recorded from HEK-Nav1.6 cells transiently expressing GFP (gray), FGF14-GFP (black), FGF14K74A-GFP (orange), FGF14I76A-GFP (orange), and FGF14K74A/I76A-GFP (green) in response to voltage steps from −120 mV to +60 mV from a holding potential of −70 mV (inset). B, current-voltage relationships of INa+ from GFP (gray), FGF14-GFP (black), and FGF14K74A/I76A-GFP (green). C, box plot represents peak current densities measured in individual HEK-Nav1.6 cells expressing GFP, FGF14, FGF14K74A-GFP, FGF14I76A-GFP, and FGF14K74A/I76A. D, representative traces of experimental groups described in A in which Tau (τ) of INa+ was estimated from a one-term exponential fitting function (red dotted line). Values are plotted as a function of amplitude and time constant. E, summary box plot of Tau calculated at the peak current density (−10 mV) in the indicated experimental groups. Data are mean ± S.E. *, p < 0.05.

