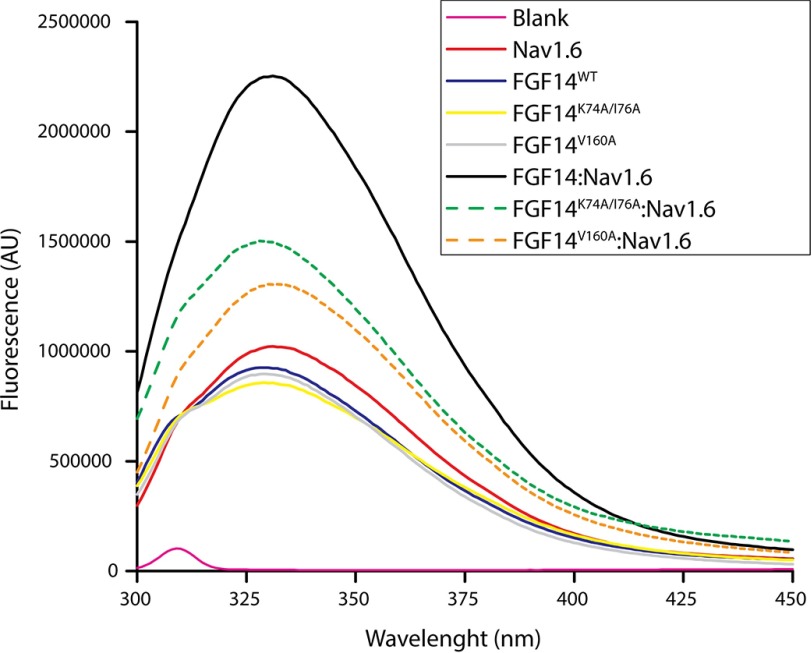
FIGURE 12.
Intrinsic fluorescence emission spectra reveal reduced assembly of FGF14K74A/I76A and FGF14V160A to Nav1.6 C-tail. Shown are the fluorescence spectra of the indicated purified proteins alone or combined; blank, Nav1.6, FGF14WT, FGF14K74A/I76A, FGF14V160A, FGF14WT·Nav1.6, FGF14K74A/I76A·Nav1.6, and FGF14V160A·Nav1.6 are shown as pink, red, blue, yellow, gray, black, green broken line, and orange broken line, respectively.

