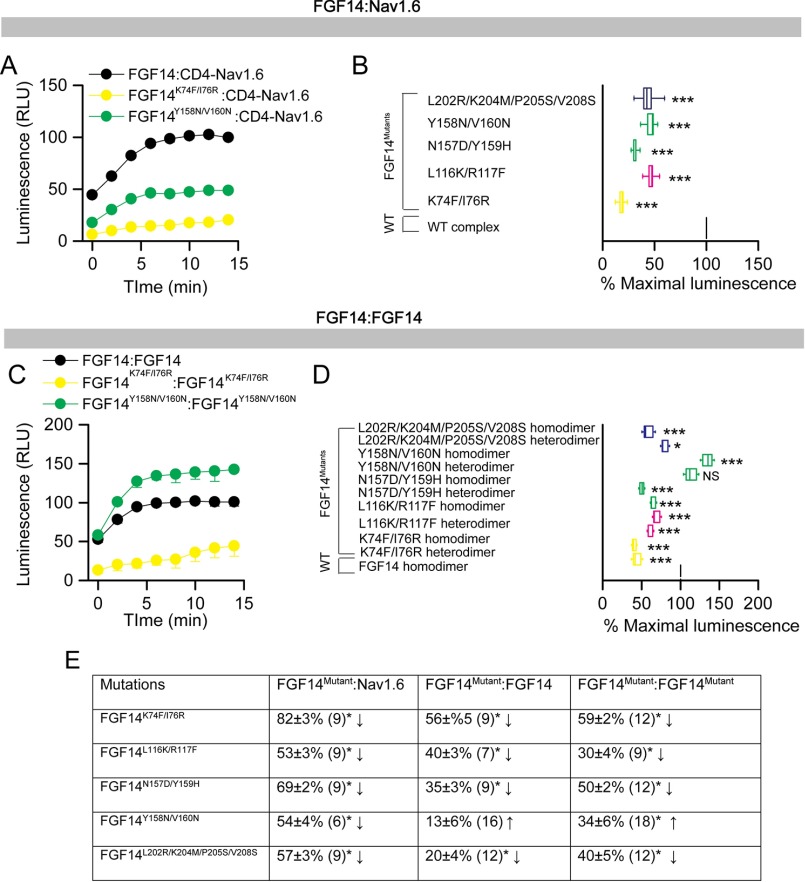
FIGURE 2.
In-cell LCA characterization of hot spots at the FGF14·Nav1.6 channel and the FGF14:FGF14 dimer interface. A, representative luminescence response (RLU) corresponding to the assembly of CLuc-FGF14·CD4-Nav1.6-NLuc (black) and the respective mutants (Y158N/V160N, green circle; K74F/I76R, yellow circle). B, box plot representing percent maximal luminescence response of relative mutants normalized to the CLuc-FGF14·CD4-Nav-NLuc control (black). C, representative luminescence response (RLU) corresponding to the assembly of CLuc-FGF14·FGF14-NLuc (black) and the respective mutants (Y158N/V160N, green circle; K74F/I76R, yellow circle). D, box plot representing percent maximal luminescence response of relative mutants normalized to the CLuc-FGF14:FGF14-NLuc (black) homodimer response. Data are mean ± S.E. The statistical significance between the three groups was assessed using Kruskal-Wallis one-way ANOVA on ranks with post hoc Dunn's method. ***, p < 0.001; *, p < 0.05. NS, not significant. E, a data summary of the modulation of hot spots in FGF14 to form the FGF14·Nav1.6 complex and the FGF14:FGF14 dimer is shown.

