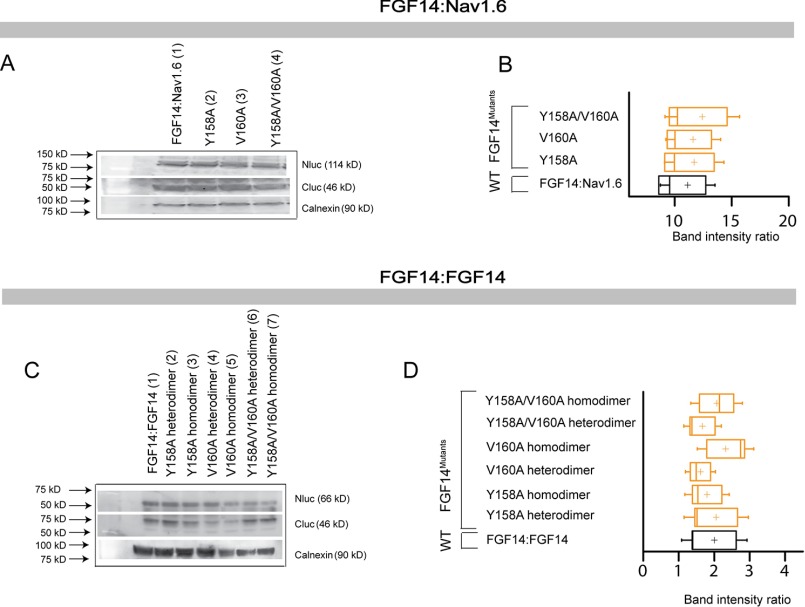
FIGURE 5.
Protein production quantification from Western blotting analysis for FGF14Y158A, FGF14V160A, and FGF14Y158A/V160A. A, Western blotting of whole-cell extracts from cells transfected with the indicated CLuc-FGF14 and CD4-Nav1.6-NLuc constructs. B, summary graph of densitometry analysis of CLuc and NLuc band intensity ratio of the respective protein products. C, Western blotting of whole-cell extracts from cells transfected with the indicated CLuc-FGF14 and FGF14-NLuc constructs. D, summary graph of densitometry analysis as described in C. Membrane were probed with anti-luciferase antibodies that recognize either the CLuc or the NLuc fragments (∼46 and ∼66/114 kDa, respectively). Immunodetection of calnexin was used as loading control.

