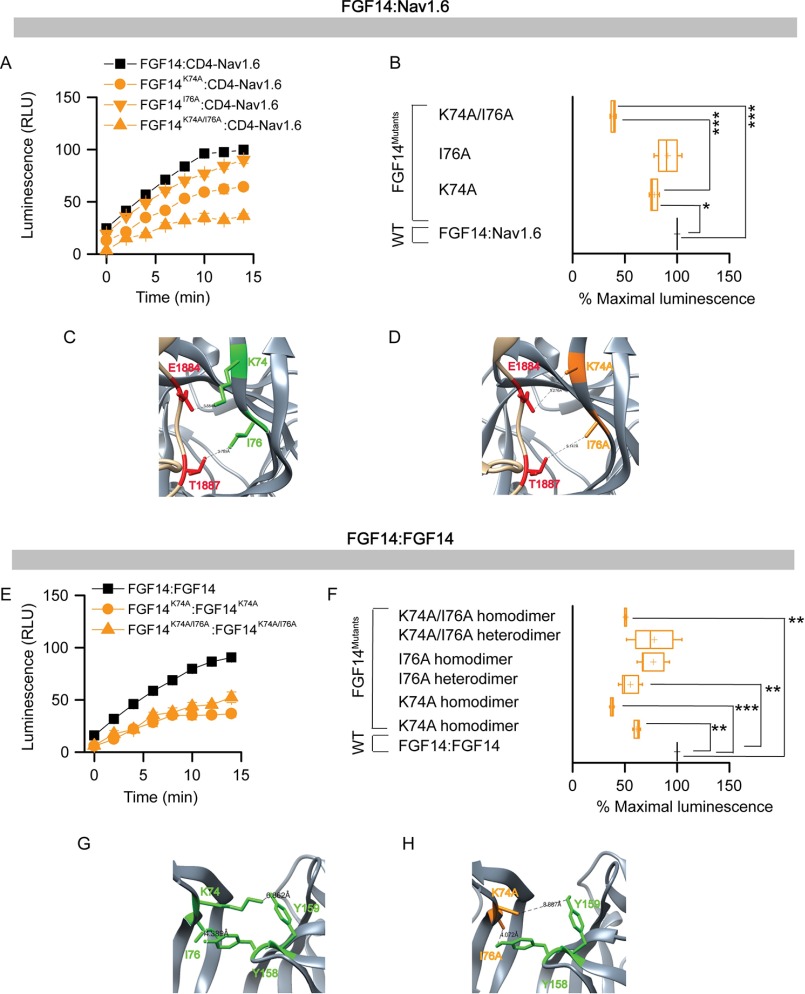
FIGURE 6.
Assessing the role of Lys-74 and Ile-76 at the FGF14·Nav1.6 channel and the FGF14:FGF14 dimer interface by alanine-scanning mutagenesis by in-cell LCA. A, representative luminescence response (RLU) corresponding to the assembly of CLuc-FGF14·CD4-Nav1.6-NLuc (black square) and respective mutants (K74A, orange circle; I76A, orange inverted triangle; K74A/I76A, orange triangle). B, box plot represents percent maximal luminescence response of relative mutants normalized to the CLuc-FGF14· CD4-Nav1.6-NLuc control (black). C, homology model of the FGF14·Nav1.6 complex (zoom view) in which FGF14 is shown as gray and the C-tail of Nav1.6 is shown as tan. Lys-74 (green) and Ile-76 (green) interact with Glu-1884 and Thr-1887 of the C-tail of Nav1.6, respectively. D, interaction of K74A (orange) and I76A (orange) of FGF14 with Glu-1884 (red) and Thr-1887 (red) of the C-tail of Nav1.6 is shown in the FGF14K74A/I76A·Nav1.6 homology model. E, representative luminescence response (RLU) corresponding to the assembly of CLuc-FGF14·FGF14-NLuc (black) and respective mutants (K74A homodimer, orange circle; K74A/I76A homodimer, upper orange triangle). F, box plot represents % maximal luminescence response of relative mutants normalized to the CLuc-FGF14:FGF14-NLuc (black) homodimer response. Data are mean ± S.E. The statistical significance between the three groups was assessed using Kruskal-Wallis one-way ANOVA on ranks with post-hoc Dunn's method; ***, p < 0.001 or **, p < 0.01. G, homology model of the FGF14:FGF14 homodimer (zoom view) in which Lys-74 (green) and Ile-76 (green) from one FGF14 monomer interacts with Tyr-159 and Tyr-158, respectively, with neighboring FGF14. H, interaction between K74A (orange) and I76A (orange) of FGF14 with Tyr-158 and Tyr-159, respectively, with neighboring FGF14 monomer is shown in the FGF14K74A/I76A:FGF14K74A/I76A homodimer model.

