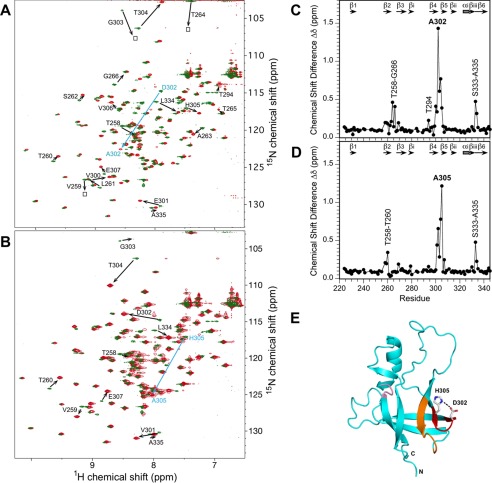
FIGURE 3.
Chemical shift changes in the I-domain accompanying the D302A and H305A substitutions at a temperature of 20 °C. A, superposition of the 1H,15N HSQC spectra for the WT I-domain (green) and the D302A mutant (red). (B) Superposed 1H,15N HSQC spectra for the WT I-domain (green) and the H305A mutant (red). In A and B large chemical shift changes are indicated by arrows, drawn from the position of the cross-peak in the WT to the position of the cross-peak in the mutant spectrum. Composite chemical shift differences were calculated as abs [ΔdHN + 0.1(ΔdN)] for D302A (C) and H305A (D). Errors in the composite chemical shift differences are estimated to be 0.08 ppm based on the acquired digital resolutions of the 1H and 15N dimensions. Segments with the largest chemical shift perturbations are labeled. E, mapping of the chemical shift differences between WT and D302A onto the I-domain structure: red, Val-300–His-305 reverse turn between strands β4-β5; orange, Thr-258–Gly-266 reverse turn between strands β2-β3; pink, long range effects for the Ser-333–Ala-335 segment. The corresponding structural mapping for H305A is nearly identical to that for D302A and is not shown.

