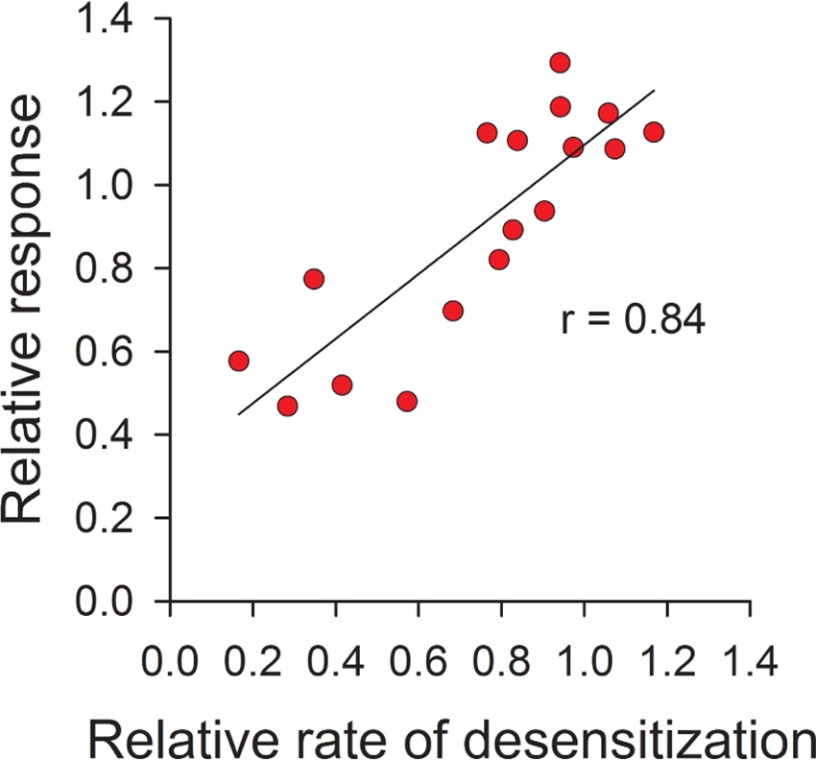
FIGURE 7.
Correlation analysis of the effect of covalent modification on the activation and desensitization of channels bearing Cys mutations in α5. The mean value for the relative response and relative rate of desensitization after MTSET treatment of individual mutants in the tract P337C to K354C are plotted. The relative response for each mutant represents the mean of the ratio of the pH-elicited peak current following MTSET treatment to the mean of the pH-elicited peak current before treatment (data from Fig. 5). The relative rate of desensitization for each mutant represents the mean of the desensitization rate following MTSET treatment to the mean of the desensitization rate before treatment (data from Fig. 6). Data were analyzed using Pearson's correlation test (r = 0.84).

