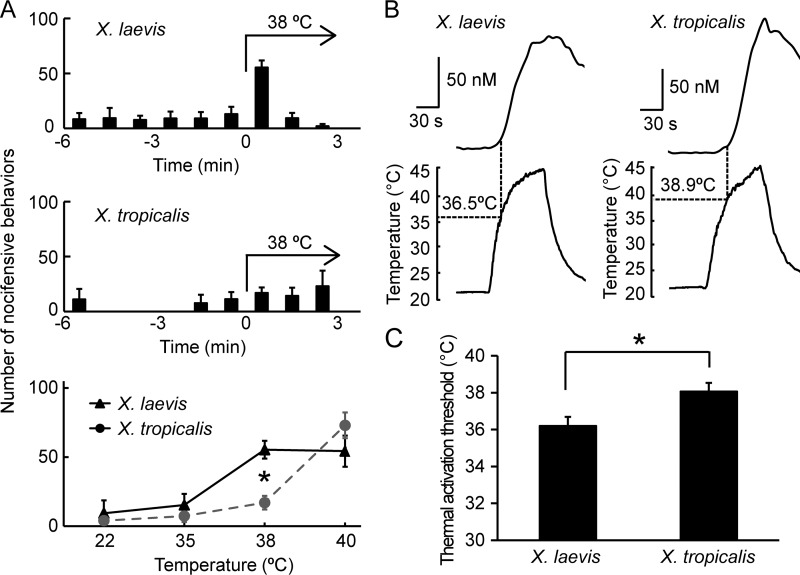
FIGURE 1.
Behavioral responses to heat and thermal sensitivity of sensory neurons differ between X. laevis and X. tropicalis. A, each bar represents the number of jumping behaviors at 1-min intervals before and during the heat stimulations (n = 4 each for both X. laevis and X. tropicalis). The number of jumping behaviors in the first 1-min interval during heat stimulation is summarized (bottom panel, n = 4, 5). *, p < 0.05, t test. Note that the data for X. tropicalis were adopted from Ohkita et al. (Ref. 4, Fig. 7F therein). B. species differences in the heat response of Xenopus DRG neurons. Representative traces of [Ca2+]i changes in response to heat stimulation in DRG neurons from X. laevis (left) and X. tropicalis (right). The thermal activation threshold is defined as the point at which [Ca2+]i exceeds 10 nm from baseline. C, comparison of thermal activation thresholds of DRG neurons between the two Xenopus species (n = 13 for X. laevis and n = 15 for X. tropicalis from 3 frogs/species). Each data point represents the mean ± S.E. *, p < 0.05, t test.

