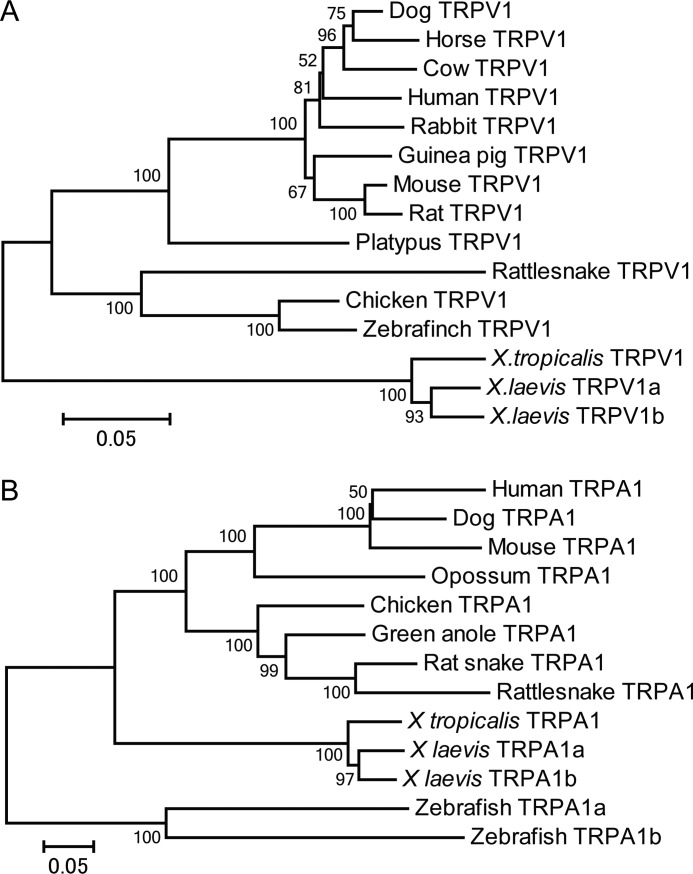
FIGURE 2.
Phylogenetic relationship of vertebrate TRPV1 (A) and TRPA1 (B) including Xenopus species. Evolutionary distances were estimated by comparing amino acid sequences, and phylogenetic trees were reconstructed with the neighbor-joining method (24). Statistical confidence (bootstrap value) is shown beside each node of the phylogenetic tree. Scale bar indicates 0.05% amino acid substitutions/site.

