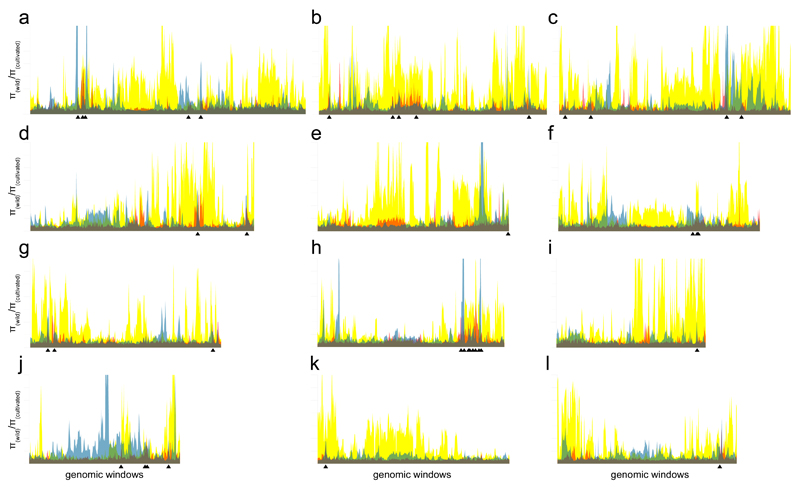
Figure 1.
Selection landscapes for the three groups of cultivated rice on each of the twelve rice chromosomes (a–l). The x-axis represents sliding windows of 2,000 (indica, japonica) or 4,000 (aus) SNPs, with sliding steps of 1,000 SNPs. The y-axis is scaled in intervals of 4 and represents the ratio of nucleotide diversity π(wild)/π(domesticated). Yellow, japonica; transparent blue, aus; transparent red, indica; green, overlaps of japonica and aus; orange, overlaps of japonica and indica; purple, overlaps of aus and indica; grey, overlaps of all three groups. Positions of 38 CLDGRs identified at π(wild)/π(domesticated)>4 are indicated with black arrowheads.

