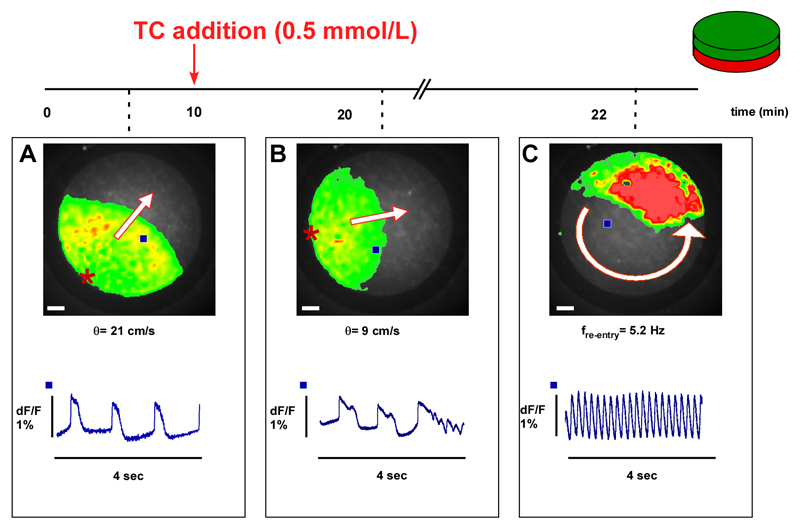
Figure 3.
Example of the arrhythmia induced by taurocholic acid (TC) in a preparation consisting of a monolayer of CMs coated with a monolayer of MFBs. A. Optical recording of spontaneous electrical activity (45 bpm, bottom) originates from the periphery and propagates uniformly at 21 cm/s. B. After acute exposure to 0.5 mmol/L, TC conduction velocity (θ) is reduced from 21 to 9 cm/s. Moreover, propagated APs display early afterdepolarizations where the last activation is followed by (C) self-sustained re-entrant excitation. Frequency of rotation is 5.2 Hz. Bar=1 mm. Blue squares in the overview indicate the locations of recorded traces. Red stars indicate the origins of spontaneous electrical activation.

