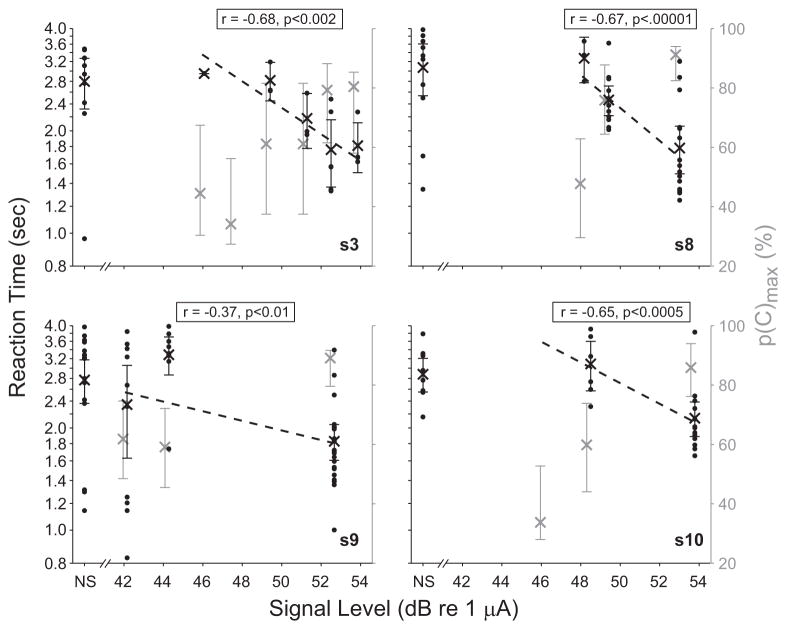
Fig. 2.
In four subjects, reaction time decreased significantly with signal level, whereas detection accuracy increased. RT is shown on the left ordinate (in black), and p(C)max on the right ordinate (in gray). Black dots indicate RT obtained on individual trials at each signal level, including no-signal “NS” trials; x’s show mean RT; dashed lines show linear least-squares fits. The correlation coefficient r between the logarithm of RT and signal level, and the significance of a negative relationship p, are indicated. Error bars show 95% confidence intervals. Only second measurement data are plotted for s8. All RTs exceeded 0.8 sec. For clarity, RT and p(C)max data have been slightly offset, by ± 0.1 dB of the actual signal level.

