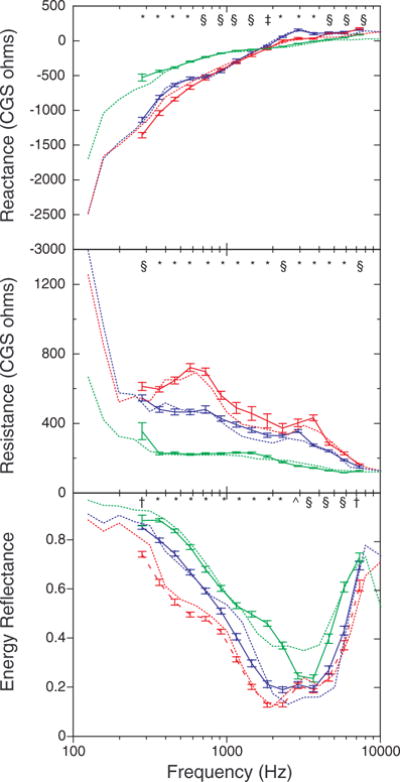
Fig. 2.

Mean ear-canal reactance (top), resistance (middle), and energy reflectance (bottom) as a function of frequency in this study (solid lines) and as reported by Keefe et al. (1993) (dotted lines) for three age groups. The data for 2- to 3-mo olds are shown in red, for 5- to 9-mo olds in blue, and for adults in green. The data from the study by Keefe et al. were from 3- and 6-mo olds. Error bars represent ±1 SEM. The symbols at the top of each panel represent the significant age differences at each frequency, with an alpha level of 0.05. The symbol * indicates that all groups differ; § indicates that infants differed from adults, but the two infant groups did not differ; † indicates that 2- to 3-mo olds differed from the other age groups, which did not differ; ^ indicates that 2- to 3-mo olds differed from adults, but 5- to 9-mo olds did not differ from either of the groups.
